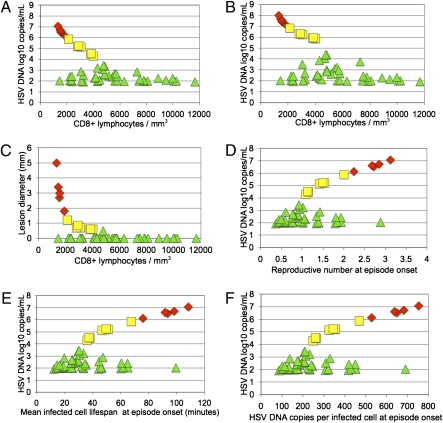
Fig. 1.
In a 365-d model simulation, CD8+ lymphocyte density (per mm3), infected cell lifespan, HSV copies produced per infected cell, and reproductive number at episode onset were determinants of shedding episode peak HSV DNA copy number and lesion diameter. Green triangles are low-copy (102 to 104 peak HSV DNA copies per milliliter), yellow squares are medium-copy (<104 to 106 peak HSV DNA copies per milliliter), and red diamonds are high-copy episodes (>106 peak HSV DNA copies per milliliter) (A) HSV-2 DNA peak copy number per episode (y axis) and CD8+ lymphocyte density at episode onset (x axis) for the 54 shedding episodes from the 365-d simulation outlined in Table 1. (B) HSV-2 DNA total copy number per episode (y axis) and CD8+ lymphocyte density at episode onset (x axis) for the 54 shedding episodes. Total HSV copy number exceeds peak HSV copy number in medium- and high-copy episodes by ≈1 log. (C) Peak lesion diameter (y axis) and CD8+ lymphocyte density (x axis) at episode onset for the 54 shedding episodes. (D) HSV-2 DNA peak copy number (y axis) and reproductive number at episode onset (x axis) for the 54 shedding episodes. (E) HSV-2 DNA peak copy number (y axis) and average infected cell lifespan at episode onset (x axis) for the 54 shedding episodes. F) HSV-2 DNA peak copy number (y axis) and mean HSV-2 production per infected cell at episode onset (x axis) for the 54 shedding episodes.

