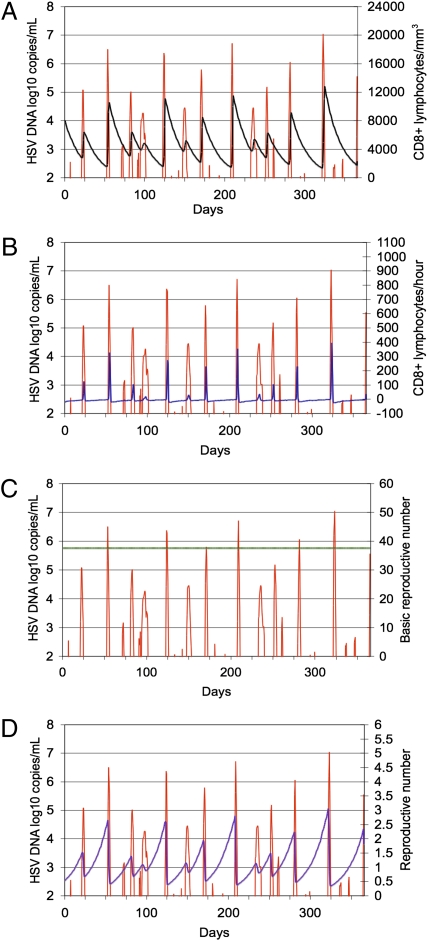
Fig. 2.
Stochastic model simulation (365 d) outlined in Table 1. (A) In this simulation, CD8+ lymphocyte replenishment randomly occurred 12 times during the course of a year. The simulation also illustrates the heterogeneity of genital HSV-2 episodes during the course of the year. Red line, log10 HSV-2 DNA/mL transport medium (left y axis). (A) Black line, CD8+ lymphocytes per mm3 (right y axis). (B) Blue line, CD8+ T-cell rate of change per hour (right y axis). Green line, basic reproductive number (R0, right y axis) (C); and violet line, reproductive number (R, right y axis) (D).

