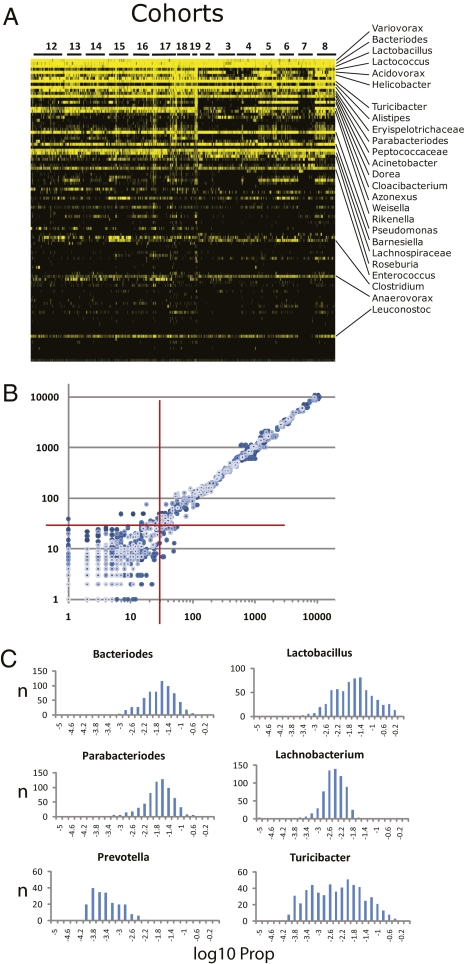
Fig. 1.
Characterization of the gut microbiota across the AIL population. (A) A heat map of the relative abundance of the top 100 genera identified in the G4 AIL population. Vertical columns represent individual animals; horizontal rows depict genera. Genera of interest are indicated. Black indicates absent taxa. (B) A scatterplot generated from pairwise combinations of data from technical repeats from five different samples. 16S rDNA from each sample was amplified with three different sets of bar-coded primers. Processed and filtered sequences from each barcode–sample combination were then assigned taxonomy by CLASSIFIER. Sequence counts for each taxonomic bin were log-transformed and plotted for all pairwise combinations of the three repeats for each sample. Axes are the log10-transformed values for total sequence reads of each taxon. The red crosshairs indicate the 30-read threshold. Above this number, correlation reaches >0.998: below this number, correlation dissipates rapidly. (C) Histograms of the frequency distribution of selected CMM taxa across the 645 animals. The histograms were plotted from log10-transformed values of the proportion (Prop) of sequence reads for each taxon (i.e., number of reads for that taxon/total sequence reads for a given animal). Thus, each histogram depicts the number of animals (y axis) with log10-transformed Prop values (x axis) for the given taxon.

