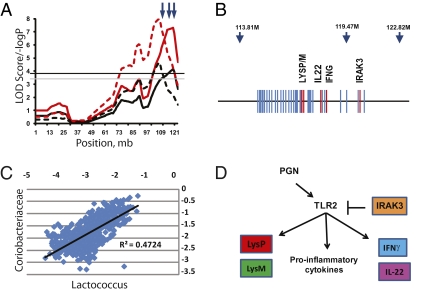
Fig. 3.
Fine structure of the genomic region of the significant QTL on chromosome 10. (A) The simple mapping output (red lines) and GRAIP permutation output (black lines) for QTL analysis of Coriobacteriaceae (solid lines) and Lactococcus (dashed lines). Genome-wide GRAIP-adjusted significance thresholds were generated from 50,000 permutations. Thus for the GRAIP output, a minimum possible P value with 50,000 permutations is 0.00002 (1/50,000), so the maximum −log P is 4.7. The black and gray horizontal lines represent the permuted 95% and 90% LOD thresholds, respectively. Arrows at the top show the relative positions of the three SNP markers nearest the QTL. (B) A scaled gene map of the QTL region. Arrows indicate SNP markers and their positions (in Mb). Genes are marked by blue; genes of interest are in red. (C) A scatterplot of log-transformed Prop values from the Coriobacteriaceae and the Lactococcus taxon bins of the 645 animals used in the study. (D) The combined functional pathways of the genes of interest in the QTL across multiple cell types. The bar from IRAK3 to TLR2 represents direct action. Arrows represent the relative influence of each gene and not necessarily direct gene action.

