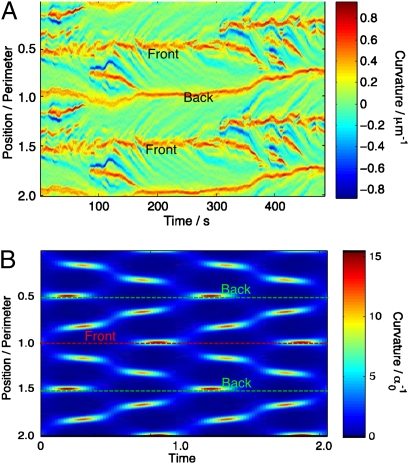
Fig. 1.
Curvature space-time plots for the contours of (A) a typical crawling cell and (B) the Shapere–Wilczek swimmer. To prevent a loss of detail at the edges, the curvature has been plotted over two contour lengths. Note the herringbone structure—regions of high curvature bifurcate at the front and travel to the back.

