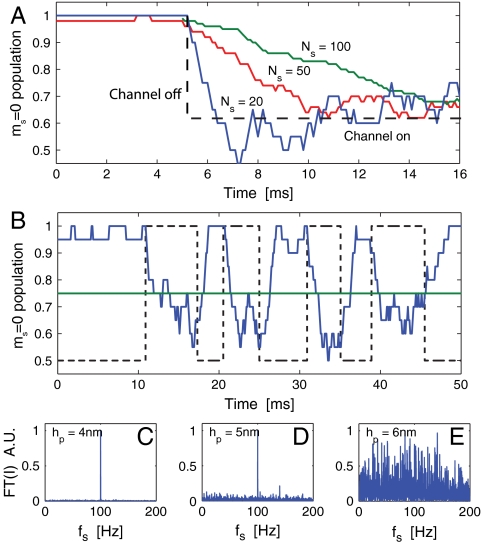
Fig. 6.
Theoretical results for the detection of ion-channel operation. (A) Plot illustrating the dependence of temporal resolution (δt) and signal variance (δP) on the number of data points included in the running average (Ns). (B) Simulated reconstruction of a sodium ion-channel signal with a 200 Hz switching rate using optical readout of an NV center (blue curve). The actual ion-channel state (on/off) is depicted by the dashed line, and the green line depicts the analytic confidence threshold. Fourier transforms of measurement records are shown in C–E for standoffs of 4, 5, and 6 nm, respectively. Switching dynamics are clearly resolvable for hp < 6 nm, beyond which there is little contrast between decoherence due to the ion-channel signal and the background.

