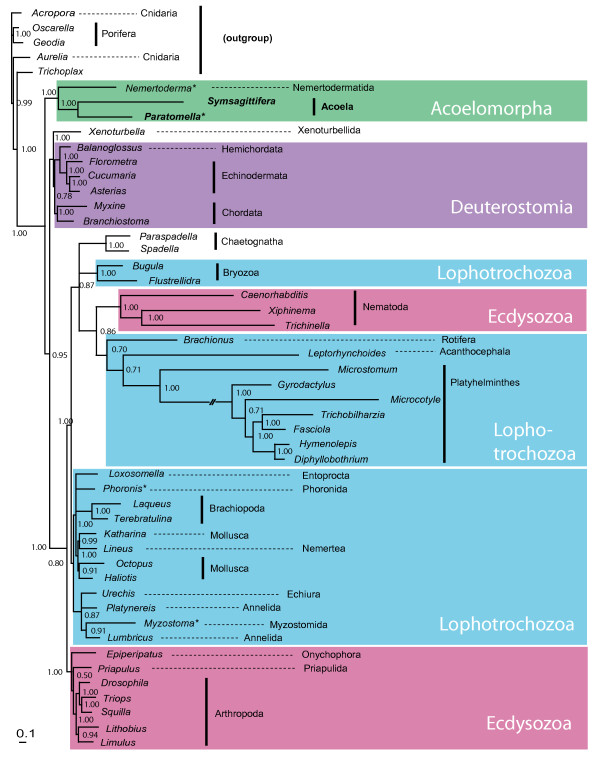
Figure 4.
Phylogenetic analysis of mitochondrial sequences - first alternative. Best tree from two of four independent chains of Bayesian inference analysis (NH-PhyloBayes, CAT-BP, concatenated amino acid alignments of 11 mitochondrial protein-coding genes). Numbers close to nodes are Bayesian posterior probabilities. Branch lengths reflect substitutions per site (see scale bar). Asterisks indicate taxa with incomplete mt genome data.

