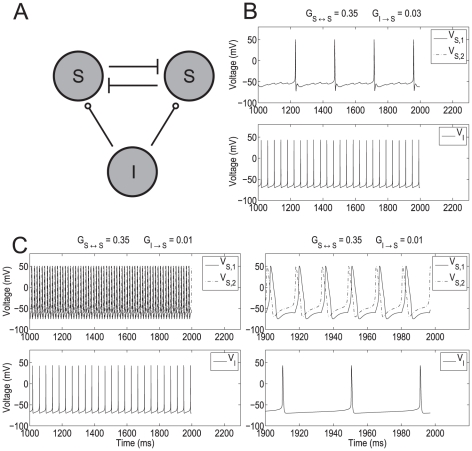
Figure 1. Abrupt transition from the theta to the hyper-excitable regime in a SI minimal network.
A: Diagram of the minimal SI network. Stellate cells (S) excite each other (AMPA) and receive inhibition (GABAA) from an interneuron (I). The maximal synaptic conductances  and
and  are represented by
  and
and  respectively. B and C: show the transition from the theta to the persistent hyper-excitable regime as the result of a small decrease in inhibition. In the theta regime SCs are synchronized in phase while in the hyper-excitable regime SCs are synchronized slightly out of phase. The right panel in C is a magnification of the left one. The parameters used are
  , and
, and  .
.

