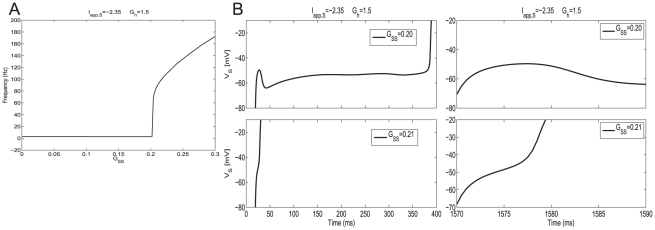
Figure 4. The NAS-SC model self-connected with an autpase captures the abrupt transition between the theta and hyper-excitable regimes as the result of small changes in the maximal synaptic conductance  .
.
A: Spiking frequency vs.  for representative values of
  and
and  . The spiking frequency is measured in number of spikes per second. The transition point corresponds to
  . B: Voltage traces for one representative values of
  on each side of (and close to) the transition point. The value of the persistent sodium maximal conductance is
  . The interspike intervals are
  ms (top-left) and
  ms (bottom-left). The right panels are magnifications of the left ones.

