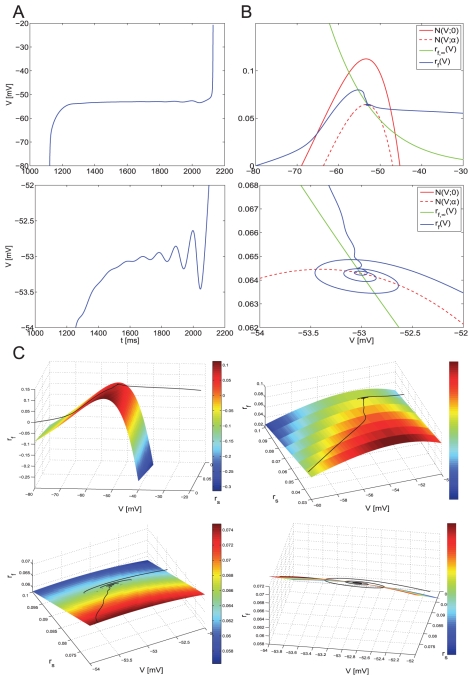
Figure 5. Phase-space diagram for the NAS-SC model in the theta regime (slow time scale).
Trajectories begin evolving from reset values  (
( measured in mV). A: Voltage trace corresponding to the trajectory shown in B and C:. The bottom panel is a magnification of the top one and shows subthreshold oscillations. B: Two-dimensional projection of the phase-space diagram shown in C. The two curves in red are contained in the V-nullsurface. The bottom panel is a magnification of the top one. C: For different views of the
  phase-space diagram showing only the V-nullsurface and the trajectory. The values of the parameters are
  .
.

