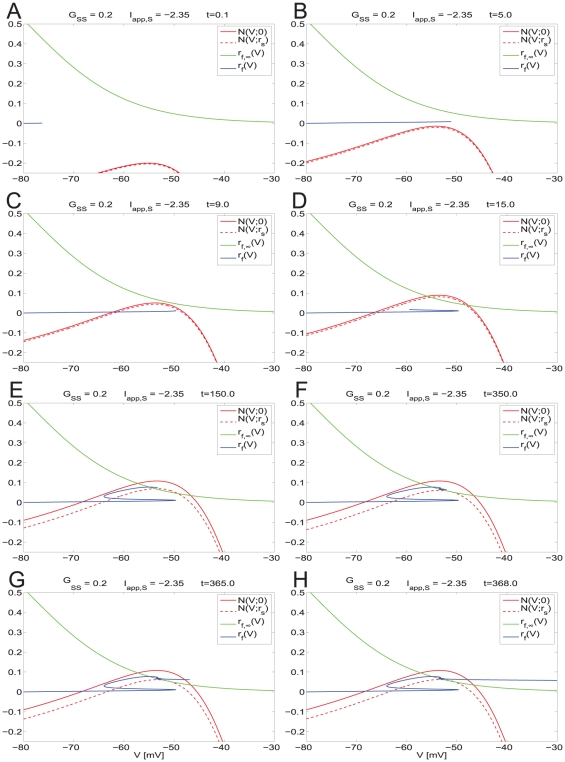
Figure 7. Dynamic two-dimensional phase-space representation of one firing phase for the self-connected NAS-SC model in the theta regime.
Parameter values are  and
and  and fixed for all diagrams. The value of
  is below the threshold for hyper-excitable firing and thus a theta frequency ISI is observed. Each panel shows the evolution of the phase space for time points through one firing phase. Time increases from A to H. As the trajectory evolves it is captured by the slow-manifold (vicinity of the V-nullsurface) and is forced to move around it on a slow time scale thus causing subthreshold oscillations.

