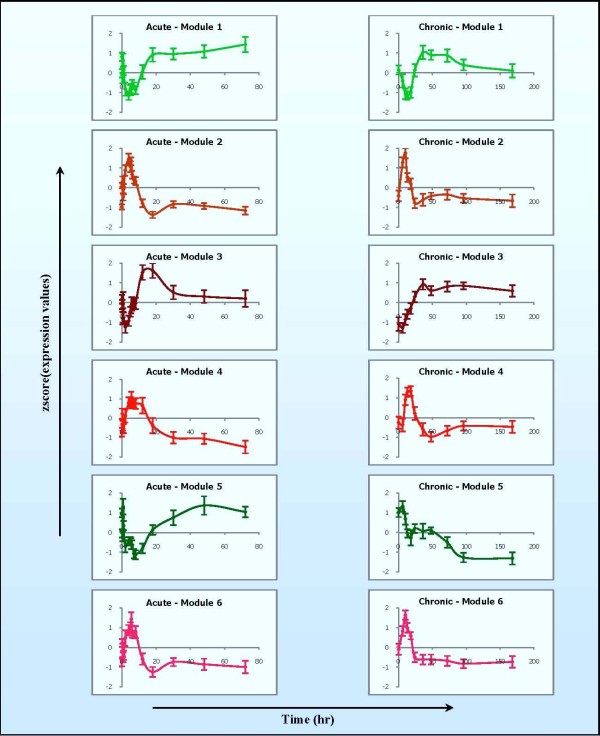
Figure 6.
Critical transcriptional modules of CS pharmacogenomic effects. Each module is characterized by the average gene expression profile of the corresponding cluster in the acute and the chronic data. The error bar shows the standard deviation of all probeset transcript levels at each time-point in each corresponding pattern.

