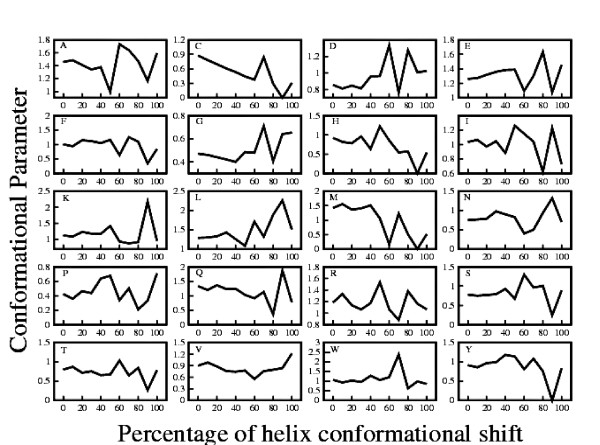
Figure 3.
Conformational Parameter vs. Percentage Ambivalency. Conformational parameters of the amino acids in the ambivalent sequences plotted as a function of their respective percentage ambivalency. Upper left part of each graph gives the one letter abbreviation of amino acid for which the graph is drawn.

