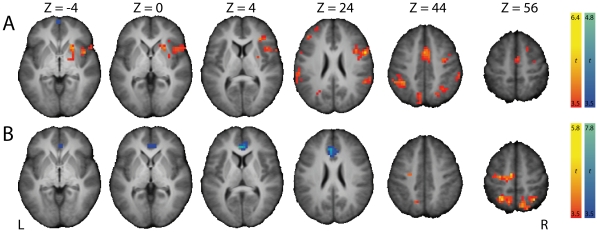
Figure 6. Brain regions with significant parametric effects of (A) stop-signal probability and (B) response time on the BOLD signal during Go trials.
Significant clusters of activation (P<.05, FWE-corrected) are displayed on the normalized and skull-stripped group-average brain (neurological orientation). L, left; R, right.

