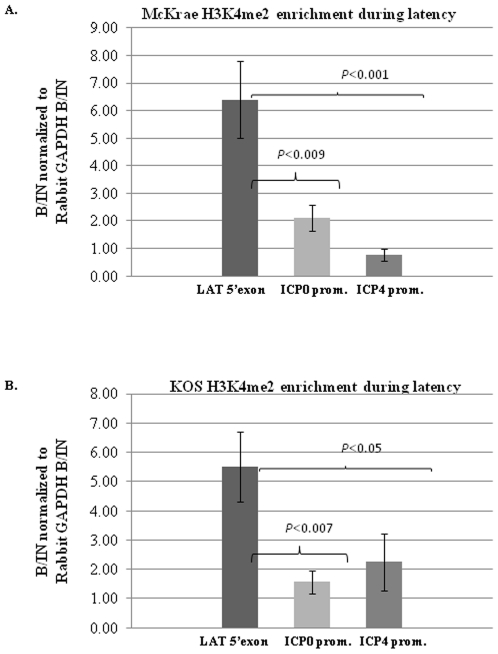
Figure 3. H3K4me2 enrichment during latency.
A.) H3K4me2 status of rabbit TG latently infected with wild type McKrae (n = 7). B.) H3K4me2 status of rabbit TG latently infected with wild type KOS (n = 7). Rabbits were infected by corneal scarification with 200,000 pfu/eye of virus. ChIP analysis were performed as previously described [20], [21], [23] with TaqMan real-time PCR used for the analysis of the LAT 5′exon, ICP0 promoter and ICP4 promoter. B/IN ratios for each target gene were normalized to the B/IN ratios of rabbit GAPDH (cellular control). Real time PCR was performed with TaqMan universal PCR master mix, No AmpErase uracil N-glycolase and target specific primers and a fluorescently labeled probe (see references within). All PCR reactions were performed in triplicate and the average C(t) values were used to determine the relative quantity of DNA in either the bound or input fractions by using the equation for a standard curve specific to the primer/probe set used. The mean values are represented by the graph and the ±SEM is presented for each region.

