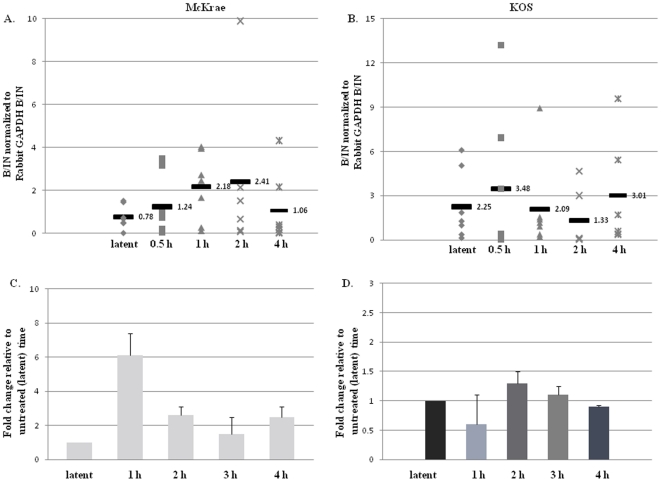
Figure 6. Changes in H3K4me2 enrichment and RNA abundance of the ICP4 promoter following transcorneal iontophoresis of epinephrine as a reactivation stressor in rabbits.
All samples were validated using a transcriptionally active (GAPDH) and a transcriptionally repressed (centromere) gene. Samples were precipitated with anti-H3K4me2 and analyzed by real-time PCR. B/IN ratios for each target gene were normalized to the B/IN ratios of rabbit GAPDH (cellular control). The mean values are represented by a horizontal bar. All assays were further validated to ensure equivalent HSV-1 genome copies were present using GADPH. One TG per experiment was used (n = 6–7) for all ChIP assays. LAT 5′exon (X14112.1-nucleotides 119326–119397) A.) H3K4me2 enrichment of the ICP4 promoter post-TCIE for the highly efficient reactivator McKrae: ChIP analyses were performed post-TCIE at 0.5, 1, 2 or 4 h (indicated on X-axis). B.) H3K4me2 enrichment of the ICP4 promoter post-TCIE for the poor reactivator KOS: ChIP analyses were performed post-TCIE at 0.5, 1, 2 or 4 h. C.) Relative change in ICP4 transcript abundance in rabbits latent with McKrae following TCIE: RNA was isolated using TRIzol reagent according to the manufacturer specifications. One rabbit TG was used per sample, and 8–10 samples were used for each time point. RNA was transformed to cDNA, and analyzed by real time PCR in triplicate. Relative quantities of were normalized to rabbit GAPDH. (There is no significant change in GAPDH expression following iontophoresis in the rabbit P>0.10) The error bars represent the positive standard deviation from the mean. The graphs are depicted as fold change in the RNA relative to the 0 h time, where the 0 h time was set to equal a value of 1. D.) Relative change in ICP4 transcript abundance in rabbits latent with KOS following TCIE.

