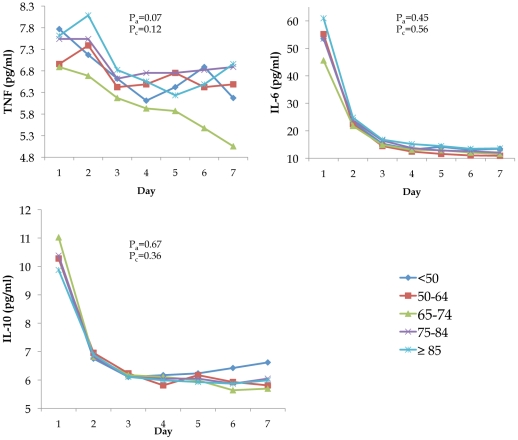
Figure 2. No differences were found in the mean values of inflammatory (TNF, IL-6, and IL-10) markers when stratified by age group.
Markers were measured upon presentation to the ED and over the first week of hospitalization. Pa are p values from Tobit models adjusted for sex, race, comorbidity, and smoking status to compare differences in mean levels of markers on Day 1 across different age groups. Pc are p values from mixed effects model adjusted for sex, race, comorbidity, and smoking status to compare mean levels over the first week.

