Abstract
Single spectrometer-based complex conjugate artifact removal methods are evaluated for in vivo imaging with complementary metal-oxide semiconductor line scan camera based high-speed Fourier-domain optical coherence tomography (FD–OCT) at 100,000 axial scans per second. Performance of three different phase-shifting methods with the same OCT engine is evaluated using modified data acquisition schemes, depending on the requirements of each phase-shifting technique. The suppression ratio of complex conjugate artifact images using a paperboard is assessed for all tested methods. Several other characteristics, including a list of additional hardware requirements (beyond standard FD-OCT components) and data acquisition schemes for each of the methods is presented. In vivo full-range images of human fingerpad and nail are shown and compared with standard FD-OCT images. Additionally, a complex-conjugate-free human retinal volume acquired at the speed of 100,000 A-scans∕s is presented.
Keywords: optical coherence tomography, imaging system, medical optics instrumentation, complex conjugate artifact
Introduction
Fourier-domain optical coherence tomography (FD-OCT)1, 2, 3 has become the technique of choice for retinal imaging over time-domain OCT, first introduced in 1991,4 due to its improved acquisition speed and sensitivity. However, a major limitation of this technique is that the Fourier transform of the real valued spectral signal from the detector results in two symmetric “mirror” images of the sample structure, the so-called complex conjugate images. This limits the usable imaging depth of the instrument, and requires the sample to be placed at the appropriate distance from the zero path length difference (between the sample and the reference arm) to avoid overlap of two complex conjugate images. This also results in reduced sensitivity due to the placement of the sample away from the zero path length difference position. To overcome this drawback, a variety of methods have been suggested to achieve full-range Fourier-domain OCT (mirror artifact-free images). The common theme of many of these techniques focuses on reconstructing the complex representation of the “real part” of the spectral fringes acquired by the OCT detector. Historically, the first phase-shifting method was demonstrated to acquire the full-range image of the porcine eye’s anterior chamber in vitro.5 Since then, several phase-shifting techniques with a piezoelectric actuator (PZT),6, 7, 8 an electro-optic phase modulator,9, 10 and an acousto-optic modulator11 were developed to eliminate the mirror image. Recently, methods were introduced using phase shifts introduced by pivot offset scanning of the sample12, 13 and reference arm mirror.14 Here, the phase-shifting methods with the PZT and pivot offsetting scanning is based on the technique first proposed by Yasuno et al.7 In addition to “active” phase-shifting techniques, several “passive” methods that include implementation of 3×3 fiber optics couplers were presented.15, 16 Due to multiple detector requirements, however, these are better suited for swept-source point detection rather than spectrometer-based FD-OCT. Additionally, a technique using nonmatched dispersion between the sample and the reference arm has been proposed.17
In this work we focus on evaluation of single-spectrometer based FD-OCT approaches. This is because of our laboratory experience in this type of instrumentation18, 19, 20 and its greatest potential for broad implementation in existing systems. Three methods are used for phase-shifting techniques that include pivot offset scanning of the sample arm and the reference arm, as well as phase shifting with the piezoelectric actuator placed at the reference arm. The suppression ratio of complex conjugate artifact-free images using a paperboard is assessed for all tested methods. Standard FD-OCT and full-range human finger images are shown at different acquisition speeds. In addition, the image quality and hardware requirements (beyond standard FD-OCT components) are compared for the different phase-shifting procedures. Complex-conjugate-free-volumetric imaging of a human retina is presented as well.
Materials and Methods
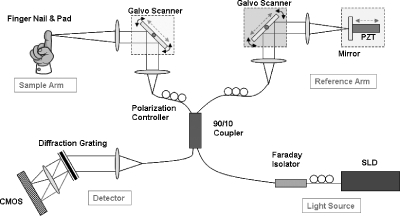
We implemented three different phase-shifting techniques using pivot offset galvo scanning in the sample arm, pivot offset galvo scanning in the reference arm, and the piezoelectric translator∕actuator (PZT) at the reference arm. Only one shifting method is applied for any given acquisition. To remove the complex conjugate artifacts, we reconstruct the complex representation of the OCT intensity spectrum using linear phase shifts between consecutive A-scans.21
Experimental System
Figure 1 shows a schematic of the FD-OCT system with three different phase-shifting method configurations. A superluminescent diode (Superlum, County Cork, Ireland) with an 890-nm central wavelength and 140-nm full width at half maximum (FWHM) was used as a light source. A fiber-based Michelson interferometer was used with a 90∕10 fiber coupler sending 10% of the light toward the sample arm. The beam output power on the sample was 450 μW. The measured axial and lateral resolutions in air were 3.6 and 9.4 μm, respectively. Light reflected from the sample was combined with the light from the reference arm, and then sent to a spectrometer, where the complementary metal-oxide semiconductor (CMOS) line detector (spL4096-140 km, Basler, Highland, Illinois), maximum 140-kHz line rate at 4096 pixels, and 10×10-μm pixel size, acquired spectral fringes. The operating setup of the detector included 4-tap 12-bit, 80-MHz, camera link clocks, and the line averaging mode (dual line 10×20 μm). B-scan imaging frame rates (frames∕s or fps) were 100, 50, and 20 fps for 1000 A-scans using 2048 detector pixels. The optical components of the spectrometer consisted of a 75-mm focal length collimator (Thorlabs, Newton, New Jersey), a 1200-line∕mm volume holographic diffraction grating (Wasatch Photonics, Logan, Utah), and an f=100 mm achromatic objective lens (Thorlabs). As shown in Fig. 1, the sample arm scanner as well as the reference arm scanner could be used to introduce phase shifts between consecutive A-scans. The galvo scanner at the sample arm is also used to scan the imaging beam over the sample at the zero offset position in two other configurations. In addition, as a separate phase-shifting component we used the piezoelectric translator (P-840.40, Physics Instruments, Auburn, Massachusetts) at the reference arm of the OCT system. The full travel displacement of the PZT is 60 μm when applying 10 V to an open loop PZT amplifier module (10× amplification). The mirror attached at the PZT was 7 mm in diameter and 22.5 g.
Figure 1.
Schematic of the FD-OCT used for evaluating complex conjugate removal methods. Three dotted rectangles represent components that are used to introduce phase shifts that were tested: SLD (superluminescent diode), CMOS (complementary metal-oxide semiconductor) line detector, and PZT (piezoelectric translator).
A Fourier reconstruction algorithm of the OCT image includes DC subtraction and a dispersion compensation method before applying complex conjugate removal procedures.21 To process the data and display the image, a main computer unit (HP xw8600, 3.2-GHz dual processors) with a rapid speed frame grabber (PCIe 1429, National Instruments, Austin, Texas), synchronized B-scan, and camera exposure timing where the FD-OCT algorithm programmed with LabVIEW software (National Instruments) was embedded. The galvo scanner and frame grabber were controlled and triggered by a module-based multifunction DAQ (NI PCIe 6363, National Instruments).
Phase-Shifting Methods
Three phase-shifting methods were used in our experiment.
Pivot scanning in the sample arm
The galvo scanner located in the sample arm introduced constant phase shifts during 1000 A-scans by causing continuous beam path length changes from offsetting the pivot point of the scanning mirror. Here, the pivot position moves in a diagonal direction at a 45-deg angle between the incident beam and the sample location to generate linearly modulated phase shifting by the pivot offset. In this configuration we used a preset scanning range of the imaging beam and changed the pivot offset to find the optimum phase-shifting value (π∕2) between A-scans.
Pivot scanning in the reference arm
The galvo scanner located in the reference arm introduced constant phase shifts during 1,000 A-scans, which were caused by continuous beam path length changes from offsetting the pivot point of the scanning mirror. As in the previous configuration, the pivot position moves in a diagonal direction at a 45-deg angle between the incident beam and the reference arm mirror to generate linearly modulated phase shifting by the pivot offset. In this configuration, the scanning range of the imaging beam can be changed as the phase shift is set in the reference arm.
Piezoelectric actuator in the reference arm
Applied voltage to the PZT produces displacement of the PZT element, which moves the reference arm mirror. Physical location changes of the reference mirror generate path length differences between the sample and the reference arm. Uniformly changing the path length difference modulates constant phase shifts over 1000 or 300 A-scans. The PZT element follows a hysteresis loop in the applied voltage versus the travel length at a preload condition.
Full-Range Image Reconstruction
Several variations of the common algorithm have been proposed for reconstructing the full-range image with phase-shifting methods. These include reconstruction using the Hilbert transformation,6 filtering with the Heaviside step function,21 and bandpass filtering.22 The Hilbert transformation method is mathematically equivalent to filtering with the Heaviside step function demonstrated by Baumann et al.21 In this work we employed the filtering algorithm with the bandpass filter because this procedure eliminates low and high frequency components, which results in enhancing image quality by suppressing trivial frequency values. For determining the filter bandwidth, it is necessary to consider that the filter output will include all frequency components of the sampled structure. Then, application of additional high pass filter limits low frequency noise. In FD-OCT, the coherence fringe spectrum including phase shifts can be expressed by
| (1) |
where k is a wave number, x and z describe the position at the sample, x and t are related by the equation, x=vx⋅t, where vx is a scanning speed of the beam at the sample. I(x,z)(k) is an interference intensity from each point along an A-scan, φsr(x,z) is a phase term between the sample and the reference arm during scanning, φshifting(t) includes phase shifts both caused by proposed phase modulation and involuntary sample motion, and φ0 denotes an initial phase. The spectroscopic fringe pattern is acquired from the image sensor so that the intensity value from the sensor, i.e., only the real part of Eq. 1 can be detected
| (2) |
Let φsr(x,z)+φshifting(t)+φ0 substitute to φtotal. To reconstruct the complex representation of the signal, one can incorporate Fourier transformation and bandpass filtering.22 The Fourier transform of the interference fringe I(k,t) along time (also includes sample lateral structure) into the frequency space creates two symmetric complex conjugate terms as:
| (3) |
Equation 3 yields complex conjugate artifact images around a zero frequency line. To eliminate one of the complex conjugate terms, a bandpass filter scaled by a factor of 2, Eq. 4, is applied to Eq. 3. Here, scaling by two preserves the signal energy during the filtering process.
| (4) |
The definition of ωshifting is an angular frequency (rad∕sec) by phase shifts, and B is the bandwidth of the filter. The multiplication of Eqs. 3, 4 results in
| (5) |
which represents only the positive side of the complex conjugate values. Following the inverse Fourier transform of the filtered output yields a complex representation of the detected signal.
| (6) |
Finally, the inverse Fourier transform along k of Eq. 6 into the z space generates the complex conjugate-free image.
Suppression Ratio and Sensitivity of Fourier-Domain Optical Coherence Tomography System
The suppression ratio (SR) is an intensity difference between maximum values of the FD-OCT sample signal and its complex conjugate suppressed (CCS) mirror signal (SR=IOCTmax∕ICCSmax). In this experiment the SR is obtained after averaging the signal from 20 A-scans to limit the effect of random phase fluctuations.
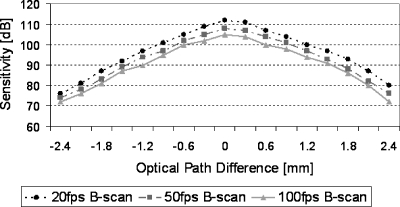
The sensitivity of the OCT system is defined by the minimum reflectivity of the sample that can be detected (signal-to-noise ratio equals one).2 One of the important parameters describing an FD-OCT system is its sensitivity drop-off due to limited spectral resolution of the detector. This was assessed by measuring sensitivity for different optical path length differences between the sample and the reference arm. Figure 2 shows the sensitivity drop-off measured in our FD-OCT system. The system sensitivity was decreased by approximately 20 dB at a 1.5-mm path length difference between the sample and the reference arm. Additionally, we evaluated sensitivity differences at different line exposure times. As expected, there is an approximately 3-dB drop between 50-fps and 100-fps B-scans at the same path length difference position. The theoretical maximal depth range zmax is given by zmax=λ2∕4δλ, where δλ is the spectrometer resolution.2 The calculated zmax of our system is ±2.5 mm. Since the maximum sensitivity is obtained at the zero path length difference position, the closer the sample is located to the zero path length difference plane, the better the sensitivity.
Figure 2.
System sensitivity measurement as a function of optical path length difference and different acquisition speeds.
Results and Discussion
Here we present the results of measuring the suppression ratio of the complex conjugate artifacts achieved with three different phase-shifting methods. Three different line exposure times, 47.9, 18, and 8.1 μs were used for image acquisition resulting in 20, 50, and 100 fps for 1000 A-scans∕frame. We analyzed the suppression ratio changes caused by sample movement as a function of different phase-shifting techniques and line exposure times. High resolution images of fingernail, volumetric representation of the fingerpad, and volumetric representation of the human retina are presented with full-range reconstruction and high-speed acquisition (100-kHz axial scans per sec) to compare image quality. The dynamic range of images shown is 36 dB for the fingernail and 40 dB for the fingerpad. Finally, Table 1 is presented to compare requirements of each phase-shifting method, assessment of method complexity, and resultant images.
Table 1.
Comparing phase-shifting methods.
| Parameter | Pivot offsetting at the sample arm | Pivot offsetting at the reference arm | PZT at the reference arm |
|---|---|---|---|
| Max suppression ratio (with a paperboard) | 25 [dB] | 21 [dB] | 20 [dB] |
| Image quality | Best complex conjugate suppression | Moderate complex conjugate suppression | Moderate complex conjugate suppression |
| Additional hardware requirement | None | One additional galvo-scanner | PZT and power amplifier |
| Scanning beam pattern | Fixed | Changeable | Changeable |
| Data acquisition | Full acquisition speed over 100,000 A-scans | Full acquisition speed over 100,000 A-scans | Restriction of phase shifting by limited PZT displacement |
| Image processing | Standard FD-OCT algorithm | Required additional DC subtraction algorithm | Required additional DC subtraction algorithm |
| Potential problems | Lower complex conjugate suppression by sample motion. Difficulty to implement in existing OCT system. | Lower complex conjugate suppression by sample motion. Increased coherence noise caused by the reference beam intensity variations. | Lower complex conjugate suppression by sample motion. Increased coherence noise caused by the reference beam intensity variations. |
Suppression Ratio
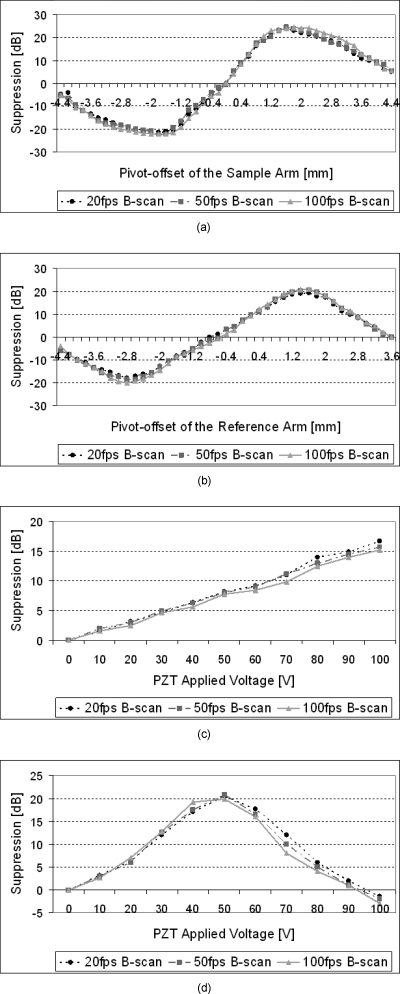
The suppression ratio (SR) is the most important parameter for complex conjugate removal methods to quantify the complex conjugate suppression. Figure 3 shows measured SR values for the three different phase-shifting methods using a paperboard as a sample. To measure the SR of the sample and the reference arm modulation methods, we moved the pivot offset position along a diagonal direction, which is a 45-deg angle between the incident beam and the sample or reference mirror. The galvanometer-based phase-shifting scanned 6 mm for the sample arm modulation and 4.5 mm for the reference arm modulation. For the PZT-based method, the SR is obtained by changing applied voltages (0 to 100 V), thereby changing the travel length (0 to 60 μm) of the PZT.
Figure 3.
Suppression ratio of complex conjugate artifacts using a paperboard with: (a) pivot offset scanning of the sample arm; (b) pivot offset scanning of the reference arm; (c) phase shifting with the PZT, 1000 A-scans, and 6-mm scanning range; and (d) phase shifting with the PZT, 300 A-scans, and 1.5-mm scanning range.
As shown in Fig. 3a, the maximum complex conjugate SR with a paperboard is around 25 dB. The phase shifting between consecutive A-scans is Δφ=0.5π, and the pivot offset position is 1.6 mm for the sample arm pivot offset scanning. As indicated in Figs. 3a, 3b, the SR is not restricted by the speed of line acquisition for the galvo-scanner-based phase-shifting methods. Our experimental SR data by the galvo-scanner-based phase-shifting methods yield similar results to those described by Leitgeb et al.13 When a mirror was placed in the sample, we observed that the maximum SR is 32 dB, which was similar to the result as explained by Fig. 2 in Ref. 13. The reason that the maximum SR of the mirror is higher than that of the paperboard is that the mirror sampling density (ρ) is higher than the paperboard one. In this work, however, we only investigated SR using real samples, a paperboard or skin, instead of using a mirror. In Figs. 3a, 3b, the SR of the sample arm pivot offsetting method is approximately 4 dB higher than that of the reference arm pivot offsetting method. The two phase-shifting methods, however, should be theoretically symmetric, since the phase shift is generated in the same way. There were intensity fluctuations in both the sample arm pivot offsetting method and the reference arm pivot offsetting method. Unlike the sample arm phase-shifting method, the reference arm pivot offsetting method uses two scanners that introduce additional phase errors that limit the maximum SR achievable. In addition, the reference beam fluctuations are more prominent than the sample arm’s due to a DC subtraction procedure used in our OCT data processing algorithm. The DC intensity fluctuates across B-scans so that the averaged DC level cannot properly correct individual A-scans. This can also explain the differences in maximum SR between two phase-shifting techniques.
The phase modulation with PZT generates 15 to 17-dB suppression of 1000 A-scans and the 6-mm scanning range, which is shown in Fig. 3c. Here, the PZT travels the full length 60 μm by applying 100 V, which is close to 0.45π phase shifts. For this acquisition scheme, the 60-μm displacement of the PZT is not enough to obtain the maximum SR. To achieve the half cycle of full phase modulation with the PZT method, we instead use 300 A-scans for one B-scan and 1.5 mm of the scanning size. In Fig. 3d, we noticed the maximum SR (20 dB) with the PZT method has a value close to the SR (21 dB) of the reference pivot offsetting method. As discussed earlier, the constraint of the PZT method is limitation of the PZT displacement, which confines the maximum phase shifts. During SR measurement with the PZT, moreover, we used a supplementary and concrete PZT mount to alleviate mechanical vibrations when the actuator is traveling.
In Vivo Full-Range Images
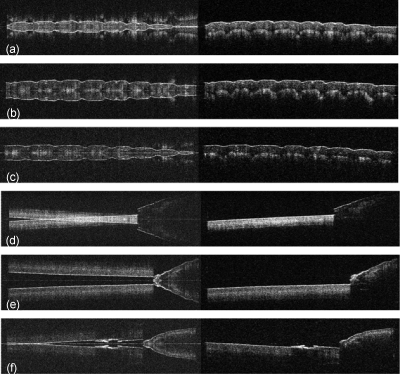
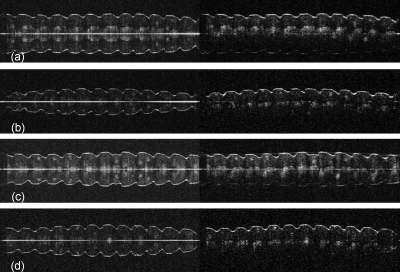
Full-range images of in vivo human tissues with different line exposure times were performed to compare image quality for the different phase-shifting schemes. We show B-scan images of the human fingerpad and nail as well as the human retina. Figure 4 shows standard FD-OCT images and full-range images of the human fingerpad and nail in vivo acquired with the sample arm pivot offsetting method for different acquisition speeds. The fast B-scan images, 100 fps, have lower intensity at a fingerpad region compared to 20-fps images (due to the sensitivity difference), but it is still possible to discriminate epidermis and the dermis layers on the fingerpad. This is expected because, as indicated in Fig. 2, the high-speed acquisition image has lower sensitivity than the slow-speed acquisition image at the same path length difference position. Complex conjugate artifacts are clearly removed for all imaging acquisition speeds using the sample arm phase-shifting method.
Figure 4.
In vivo images of human fingerpads and fingernails acquired at different image acquisition speeds with standard FD-OCT reconstruction (left column) and the full-range reconstruction with the sample arm pivot offset phase-shifting (Δφ=0.5π) method (right column). Human fingerpad at (a) 20-fps, (b) 50-fps, and (c) 100-fps B-scans. Human fingernail at (d) 20-fps, (e) 50-fps, and (f) 100-fps B-scans. The lateral scanning range is 6 mm.
The images shown in Fig. 5 were acquired using phase-shifting methods with the reference arm pivot offset method and the PZT-based phase-shift method. Complex conjugate artifact-free images acquired at 20 fps in Figs. 5a, 5c retain some residual mirror artifacts, since the SR cannot suppress the mirror signal completely, where the signal-to-noise ratio is over the maximum SR. In addition to Figs. 5a, 5c, the reference-arm-based phase modulation methods have higher coherence noise than the sample arm phase modulation method illustrated in Figs. 4a, 4c. Displacement of the reference arm mirror position reduces the reference beam stability when the sample is scanned. Thus, the reference beam intensity changes during the phase modulation, requiring an additional DC subtraction algorithm to compensate the DC value variations over A-scans. Furthermore, the reference arm phase modulation methods demand careful attention to the reference beam alignment for reducing reference beam intensity changes. Note that the fast acquisition images, Figs. 5b, 5d, have less visible mirror artifacts than 20-fps B-scan images. The system sensitivity drops by approximately 6 dB between 20 fps to 100 fps, as shown in Fig. 2; however, the SR drop from 20 fps to 100 fps is approximately 2 dB, demonstrated in Fig. 3c. This is the reason that we can see more artifacts in Fig. 5c with 20 fps than Fig. 5d with 100 fps, because the sample structure signal at 20 fps is stronger than that at 100 fps. Comparing Figs. 45, we note that the phase-shifting method of the sample arm has better complex conjugate suppression than that of the reference arm. However, the sample arm phase-shifting method may not be easily implemented with some existing OCT systems or more complex ones, such as those involving adaptive optics.20 Thus, the reference arm pivot offsetting method is an interesting alternative to sample-arm-based phase shifting. The maximum phase shift achieved with our PZT was 0.45π for 1000 A-scans due to the limit of the PZT displacement. Note that the standard FD-OCT imaging method does not allow placement of the sample at the zero path length difference position. This is because of overlap in the complex conjugate images and the potential for flipping complex conjugate images by sample motion. Also, positioning of the sample further away from the zero path length difference line diminishes the maximum achievable sensitivity. However, when using full-range imaging with the complex conjugate removal method, it is possible to achieve maximum sensitivity, which is critical in high-speed imaging where short exposure times lower the system sensitivity.
Figure 5.
In vivo human fingerpad images for different phase-shifting methods with standard FD-OCT reconstruction (left) and full-range image reconstruction (right). (a) 20-fps B-scans with the reference arm pivot offset method (Δφ=0.5π). (b) 100-fps B-scans with the reference arm pivot offset method (Δφ=0.5π). (c) 20-fps B-scans with the PZT-based phase-shifting method (Δφ=0.45π). (d) 100-fps B-scans with the PZT-based phase-shifting method (Δφ=0.45π). The lateral scanning range of images is 8.5 mm.
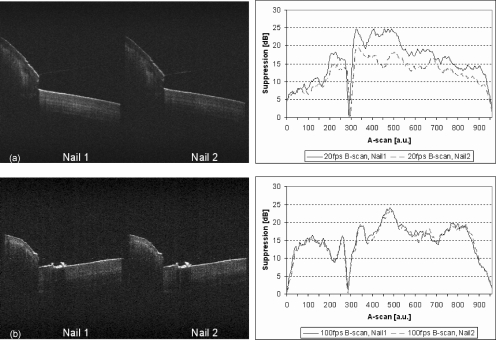
One limitation of acquiring full-range images in vivo is reduction of the suppression ratio due to sample movement.21 Figure 6 illustrates the suppression ratio differences between one stationary position Nail 1 and a moving sample Nail 2. The SR for those images is calculated by subtraction of the two strongest signals, a real image (positive side) and a suppressed mirror image (negative side), across the zero delay. Comparing SR of the paperboard in Fig. 3 to the SR of the fingernails in Fig. 6, different scanning structures and areas can have different maximum SR values because of signal intensity differences from these structures. The SR cannot be higher than signal-to-noise ratio for a given structure. Additional phase shifts by sample motion reduce the SR due to changing the Δφ value. When the sample was moving, the complex conjugate suppression ratio diminished by as much as 10 dB for the 20-fps acquisition. Despite sample movement, 100-fps B-scan images are virtually free of this artifact and have stable SR across B-scans compared to the slow-speed acquisition images.
Figure 6.
Decreasing suppression ratio by sample movement. B-scan images with the sample arm pivot offset method (Δφ=0.5π) of in vivo human fingernail images at a stationary position Nail 1, and the sample moved Nail 2 (left), and complex conjugate suppression ratio of Nail 1 and Nail 2 (right). Fingernails at (a) 20-fps B-scan, (b) 100-fps B-scan, and the suppression ratio. The lateral scanning range of each nail image is 6 mm.
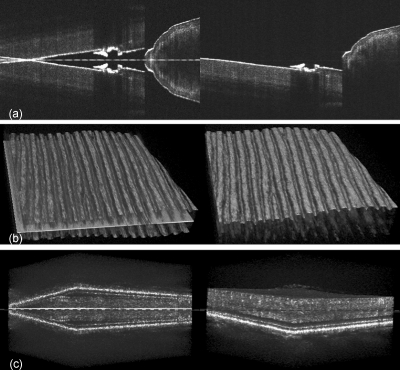
Figure 7 demonstrates standard FD-OCT images and our full-range FD-OCT images of a fingernail, a 3-D fingerpad, and a 3-D human retina acquired at 100 fps. Figure 7a is a high resolution image of full-range fingernail with an average of 20 frames to reduce speckles. Clearly fast acquisition speed helped to reduce motion artifacts. In addition, Fig. 7b shows volumetric representation of the human fingerprint image before and after removal of the complex conjugate artifacts. Although the fingerpad is placed at the zero path length difference line, an overlapped complex conjugate image is removed by the method. Note that the sample arm power was about 450 μW. Figure 7c shows complex conjugate removed volumetric representation of the human retina of a healthy volunteer using the reference arm pivot offsetting method and the 100-fps acquisition speed. Here, the dashed line indicates the zero path length difference position.
Figure 7.
In vivo standard FD-OCT images (left) and full-range images (right) after reconstruction of the complex-conjugate-free methods. (a) High resolution fingernail images at 100-fps B-scan without and with the sample arm pivot offset method (Δφ=0.5π). The lateral scan range of the images is 6 mm. (b) 3-D visualization of a human fingerpad at 100-fps B-scan without and with the reference arm pivot offset method (Δφ=0.5π). The image size is 8.5(x)×8.5(y) mm. (c) In vivo 3-D human retinal imaging at 100-fps B-scan without and with the reference arm pivot offset method (Δφ=0.5π). The region of interest is 3(x)×3(y) mm. The dashed line is the zero path length difference position.
Comparison Among Three Phase-Shifting Techniques
To evaluate proposed phase-shifting schemes, Table 1 compares all three techniques: the pivot offset scanning of the sample arm, the pivot offset scanning of the reference arm, and the PZT at the reference arm. Here, image quality is determined as the maximum SR, which indicates the quantity of the complex conjugate suppression. The sample arm pivot offsetting method can only use a fixed scanning pattern, because the sample arm performs both image scanning and phase modulation. Therefore, this method leads to limited accessible sampling patterns. However, there is no restriction on selection of beam scanning patterns for the reference arm phase-shifting methods. As demonstrated in Figs. 3c, 3d, the PZT method at the reference arm operates complex conjugate removal with limited phase shifts. By contrast, pivot offsetting methods based on the scanning mirror accomplish full phase shifting and are adequate for fast acquisition schemes. Supplementary DC subtraction processing is necessary to lower coherence noise of the reference arm phase modulation methods. Although these complex conjugate removal methods depend on sample motion, we note that increased acquisition speed can minimize the motion artifacts of the phase-shifting methods.
Conclusions
Three phase-shifting techniques are evaluated for complex conjugate artifact removal with FD-OCT imaging: pivot offset scanning of the sample arm, pivot offset scanning of the reference arm, and phase shifting with a piezoelectric actuator. The full-range images are acquired by using the filtering algorithm with the phase-shifting procedure. The maximum suppression ratio is measured when phase shifts between consecutive A-scans have Δφ=0.5π. Pivot offsetting of the sample arm scanning technique achieves a maximum complex conjugate suppression ratio of nearly 25 dB when using a paperboard. The drawback of the sample arm pivot offsetting method is the restriction on the sampling patterns. The galvo-scanner-based phase-shifting methods have no limitation of acquisition speed. High-speed image acquisition using the CMOS camera enables the phase-shifting method to have a robust suppression ratio by minimizing motion artifacts of the sample. For clinical imaging, complex conjugate artifact-free images are beneficial for the extended image range as well as increased image sensitivity, when placing the sample at the zero path length difference position. Relatively good performance of the phase shifting by pivot offsetting of the reference arm is promising, because it can be implemented in existing FD-OCT systems without any changes in the sample arm.
Acknowledgments
This research was supported by the National Eye Institute (EY 014743), and a Research to Prevent Blindness Senior Scientist Award.
References
- Wojtkowski M., Leitgeb R., Kowalczyk A., Bajraszewski T., and Fercher A. F., “In vivo human retinal imaging by Fourier domain optical coherence tomography,” J. Biomed. Opt. 7, 457–463 (2002). 10.1117/1.1482379 [DOI] [PubMed] [Google Scholar]
- Leitgeb R., Hitzenberger C. K., and Fercher A. F., “Performance of Fourier domain vs. time domain optical coherence tomography,” Opt. Express 11, 889–894 (2003). 10.1364/OE.11.000889 [DOI] [PubMed] [Google Scholar]
- Nassif N. A., Cense B., Park B. H., Pierce M. C., Yun S. H., Bouma B. E., Tearney G. J., Chen T., and de Boer J. F., “In vivo high-resolution video-rate spectral-domain optical coherence tomography of the human retina and optic nerve,” Opt. Express 12, 367–376 (2004). 10.1364/OPEX.12.000367 [DOI] [PubMed] [Google Scholar]
- Huang D., Swanson E. A., Lin C. P., Schuman J. S., Stinson W. G., Chang W., Hee M. R., Flotte T., Gregory K., Puliafito C. A., and Fujimoto J. G., “Optical coherence tomography,” Science 254, 1178–1181 (1991). 10.1126/science.1957169 [DOI] [PMC free article] [PubMed] [Google Scholar]
- Wojtkowski M., Kowalczyk A., Leitgeb R., and Fercher A. F., “Full range complex spectral optical coherence tomography technique in eye imaging,” Opt. Lett. 27, 1415–1417 (2002). 10.1364/OL.27.001415 [DOI] [PubMed] [Google Scholar]
- Wang R. K., “In vivo full range complex Fourier domain optical coherence tomography,” Appl. Phys. Lett. 90, 054103 (2007). 10.1063/1.2437682 [DOI] [Google Scholar]
- Yasuno Y., Makita S., Endo T., Aoki G., Itoh M., and Yatagai T., “Simultaneous B-M-mode scanning method for real-time full-range Fourier domain optical coherence tomography,” Appl. Opt. 45, 1861–1865 (2006). 10.1364/AO.45.001861 [DOI] [PubMed] [Google Scholar]
- Tao Y. K., Zhao M., and Izatt J. A., “High-speed complex conjugate resolved retinal spectral domain optical coherence tomography using sinusoidal phase modulation,” Opt. Lett. 32, 2918–2920 (2007). 10.1364/OL.32.002918 [DOI] [PubMed] [Google Scholar]
- Goetzinger E., Pircher M., Leitgeb R. A., and Hitzenberger C. K., “High speed full range complex spectral domain optical coherence tomography,” Opt. Express 13, 583–594 (2005). 10.1364/OPEX.13.000583 [DOI] [PMC free article] [PubMed] [Google Scholar]
- Zhang J., Nelson J. S., and Chen Z. P., “Removal of a mirror image and enhancement of the signal-to-noise ratio in Fourier-domain optical coherence tomography using an electro-optic phase modulator,” Opt. Lett. 30, 147–149 (2005). 10.1364/OL.30.000147 [DOI] [PubMed] [Google Scholar]
- Bachmann A. H., Leitgeb R. A., and Lasser T., “Heterodyne Fourier domain optical coherence tomography for full range probing with high axial resolution,” Opt. Express 14, 1487–1496 (2006). 10.1364/OE.14.001487 [DOI] [PubMed] [Google Scholar]
- An L. and Wang R. K., “Use of a scanner to modulate spatial interferograms for in vivo full-range Fourier-domain optical coherence tomography,” Opt. Lett. 32, 3423–3425 (2007). 10.1364/OL.32.003423 [DOI] [PubMed] [Google Scholar]
- Leitgeb R. A., Michaely R., Lasser T., and Sekhar S. C., “Complex ambiguity-free Fourier domain optical coherence tomography through transverse scanning,” Opt. Lett. 32, 3453–3455 (2007). 10.1364/OL.32.003453 [DOI] [PubMed] [Google Scholar]
- Szkulmowski M., Grulkowski I., Szlag D., Szkulmowska A., Kowalczyk A., and Wojtkowski M., “Flow velocity estimation by complex ambiguity free joint spectral and time domain optical coherence tomography,” Opt. Express 17, 14281–14297 (2009). 10.1364/OE.17.014281 [DOI] [PubMed] [Google Scholar]
- Sarunic M. V., Applegate B. E., and Izatt J. A., “Real-time quadrature projection complex conjugate resolved Fourier domain optical coherence tomography,” Opt. Lett. 31, 2426–2428 (2006). 10.1364/OL.31.002426 [DOI] [PubMed] [Google Scholar]
- Sarunic M. V., Choma M. A., Yang C. H., and Izatt J. A., “Instantaneous complex conjugate resolved spectral domain and swept-source OCT using 3×3 fiber couplers,” Opt. Express 13, 957–967 (2005). 10.1364/OPEX.13.000957 [DOI] [PubMed] [Google Scholar]
- Hofer B., Považay B., Hermann B., Unterhuber A., Matz G., and Drexler W., “Dispersion encoded full range frequency domain optical coherence tomography,” Opt. Express 17, 7–24 (2009). 10.1364/OE.17.000007 [DOI] [PubMed] [Google Scholar]
- Zawadzki R. J., Jones S. M., Olivier S. S., Zhao M. T., Bower B. A., Izatt J. A., Choi S., Laut S., and Werner J. S., “Adaptive-optics optical coherence tomography for high-resolution and high-speed 3D retinal in vivo imaging,” Opt. Express 13, 8532–8546 (2005). 10.1364/OPEX.13.008532 [DOI] [PMC free article] [PubMed] [Google Scholar]
- Alam S., Zawadzki R. J., Choi S. S., Gerth C., Park S. S., Morse L., and Werner J. S., “Clinical application of rapid serial Fourier domain optical coherence tomography for macular imaging,” Ophthalmology 113, 1425–1431 (2006). 10.1016/j.ophtha.2006.03.020 [DOI] [PMC free article] [PubMed] [Google Scholar]
- Zawadzki R. J., Choi S. S., Fuller A. R., Evans J. W., Hamann B., and Werner J. S., “Cellular resolution volumetric in vivo retinal imaging with adaptive optics—optical coherence tomography,” Opt. Express 17, 4084–4094 (2009). 10.1364/OE.17.004084 [DOI] [PMC free article] [PubMed] [Google Scholar]
- Baumann B., Pircher M., Götzinger E., and Hitzenberger C. K., “Full range complex spectral domain optical coherence tomography without additional phase shifters,” Opt. Express 15, 13375–13387 (2007). 10.1364/OE.15.013375 [DOI] [PMC free article] [PubMed] [Google Scholar]
- Wang R. K., “Fourier domain optical coherence tomography achieves full range complex imaging in vivo by introducing a carrier frequency during scanning,” Phys. Med. Biol. 52, 5897–5907 (2007). 10.1088/0031-9155/52/19/011 [DOI] [PubMed] [Google Scholar]


