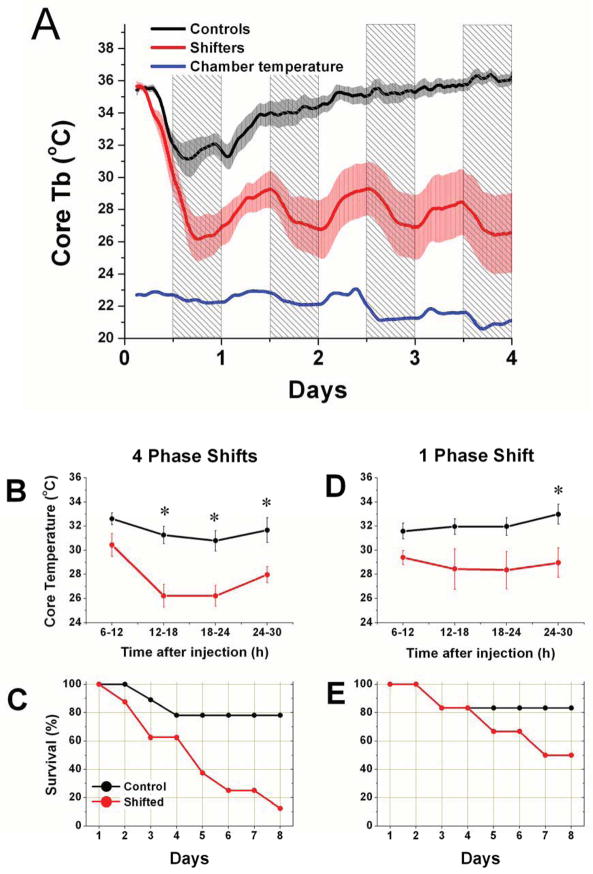
Figure 2. The effects of LPS challenge after chronic jet lag.
A. Mean core body temperature (±SEM) after LPS challenge in control (black) and 4-week CJL-exposed (red) mice. Chamber temperature is shown in blue to indicate the increase in environmental temperature during the light phase of each day. The nighttime is indicated by shading. B. Average temperature in 6h time bins was calculated for each mouse for the 2 days after LPS injection, and then group means (±SEM) were compared. * p<0.05. C. Survival curve for 4-week shifters and controls after LPS challenge. D. 6h temperature comparison after LPS challenge for mice exposed to 1 phase shift, compared against control mice. Same conventions as B. E. Survival curve for LPS challenge after 1 shift. Same conventions as C.

