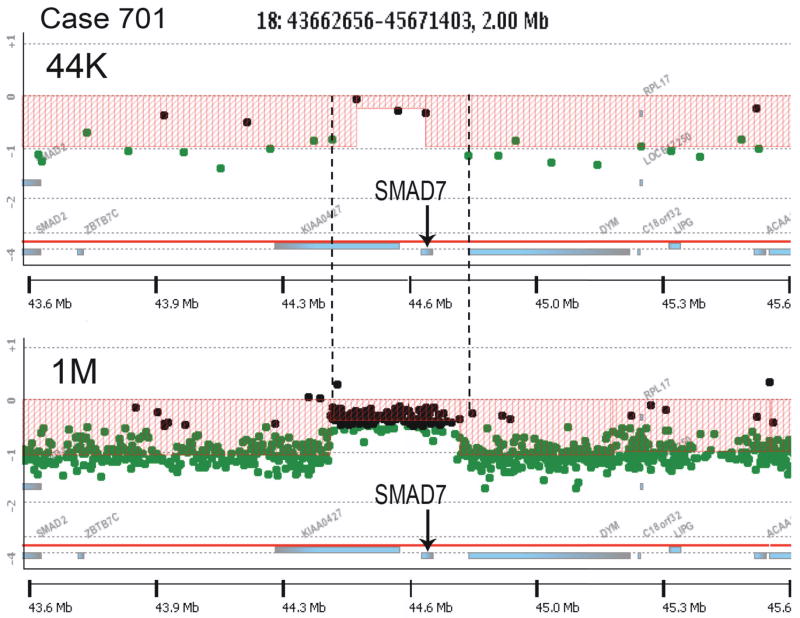
Figure 3.
Array CGH analysis with the Agilent 44K (top) and 1M (bottom) arrays of a 2Mb region of chromosome 18q21 from a colon cancer. Filled circles represent probes with no changes (black) and probes lost (green). 44K array analysis revealed a region close to SMAD7 that ‘escaped’ from loss (indent in the red area). The vertical dashed lines indicate the estimated maximum size of the region (~337Kb), determined by the closest neighbor probes that are lost (in green). The 1M array analysis confirmed that this ~300Kb region, containing the complete gene SMAD7, had escaped from the loss that affected the surrounding area.

