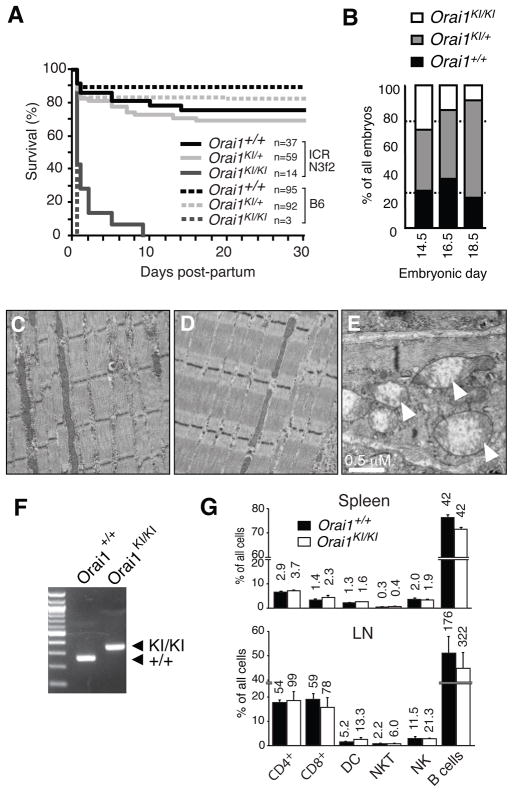
Fig. 1. Phenotype of homozygous Orai1KI/KI (knock-in) mice.
A, Homozygous Orai1KI/KI mice are neonatally lethal on the C57BL/6 background. Mice heterozygous for the Orai1 mutation (Orai1KI/+ on C57BL/6) were intercrossed or first crossed to the outbred ICR strain for 3 generations and then intercrossed. Homozygous Orai1KI/KI mice on the C57BL/6 background all died within ~ 12h post partum. A minority of outbred Orai1KI/KI (ICR N3f2) mice survived for up to 9 days post partum but was severely runted. Numbers (n) of mice per genotype analyzed are indicated. B, Moderately impaired embryonic development of Orai1KI/KI mice. Progeny of intercrossed Orai1KI/+ (C57BL/6) mice were analyzed for genotype, viability and morphological abnormalities at E14.5 (n=42), E16.5 (n=29) and E18.5 (n=47) of gestation. The number of Orai1KI/KI embryos at E18.5 was reduced compared to a normal Mendelian distribution (indicated by dotted lines). C–E, Intact myofibril structure in Orai1KI/KI mice. Muscle fibers from the lower extremity of 7-day-old wildtype Orai1+/+ (C) and Orai1KI/KI (D) mice (both ICR N3f2) were analyzed by transmission electron microscopy (magnification 11,500x). E, A minority of muscle fibers in the leg of 7-day-old Orai1KI/KI (ICR N3f2) mice contains enlarged mitchondria with dissolved cristae structure (arrow in E, magnification 19,500x). F, Fetal liver chimeric (FLC) mice were generated by transfer of fetal liver cells from Orai1KI/KI and Orai1+/+ (C57BL/6) E14.5 mouse embryos to sublethally irradiated Rag2−/−, cγ −/− mice. PCR based genotyping of CD4+ T cells from FLC mice identifies ~280 and ~320 bp bands for the wildtype Orai1+/+ and targeted Orai1KI/KI locus containing a loxP site, respectively (see Supplemental Fig. 1). G, Orai1KI/KI FLC mice have normal lymphocyte numbers in spleen and peripheral lymph nodes (LN). Numbers above bars indicate absolute numbers of cells in spleen (x106) and one peripheral LN (x103, averaged from 1–4 LNs harvested per mouse). Averages (± SEM) are from 4 mice per group.

