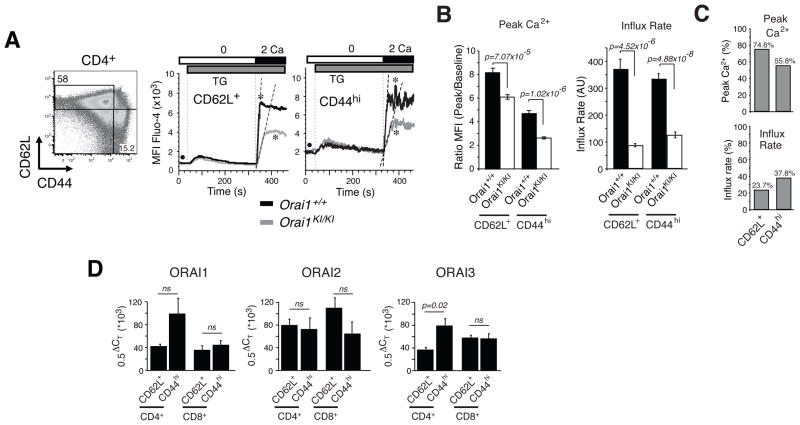
Fig. 4. SOCE defect in naive and memory CD4+ T cells from Orai1KI/KI mice.
A, For measurements of SOCE by flow cytometry, mononuclear cells were isolated from lymph nodes of Orai1KI/KI and Orai1+/+ control mice, stained with antibodies to CD4, CD44 and CD62L, loaded with Fluo-4 and stimulated with thapsigargin (TG). Representative Ca2+ traces from naive CD4+ CD62L+ CD44lo T cells (abbreviated as CD62L+) and memory CD4+ CD62L− CD44hi T cells (abbreviated as CD44hi). * indicates the peak Ca2+ response; • indicates baseline [Ca2+]i; dashed lines indicate initial rates of Ca2+ influx. B, Bar graphs show averages (±SEM) of peak Ca2+ responses (indicated by * in panel A) normalized to baseline (indicated by • in panel A) and initial rates of Ca2+ influx after readdition of 2 mM extracellular Ca2+ from n=13 (Orai1+/+) and n=19 (Orai1KI/KI) repeat experiments. p-values, Student’s t-test. C, Peak Ca2+ levels and influx rates in Orai1KI/KI T cells in percent of values observed in wildtype T cells; derived from data in B. D, Comparable expression levels of ORAI1, ORAI2 and ORAI3 in naive and memory T cells. CD4+ and CD8+ naive CD62L+ CD44lo and memory CD62L– CD44hi T cells from wildtype mice were sorted by FACS and analyzed by quantitative real-time PCR for mRNA expression of ORAI1, ORAI2 and ORAI3. Averages (±SEM) are from six repeat experiments (except for ORAI1 in CD8+ CD62L–CD44hi T cells, n=3) performed in triplicates. ΔCT, threshhold cycle differential. p-values, Student’s t-test.

