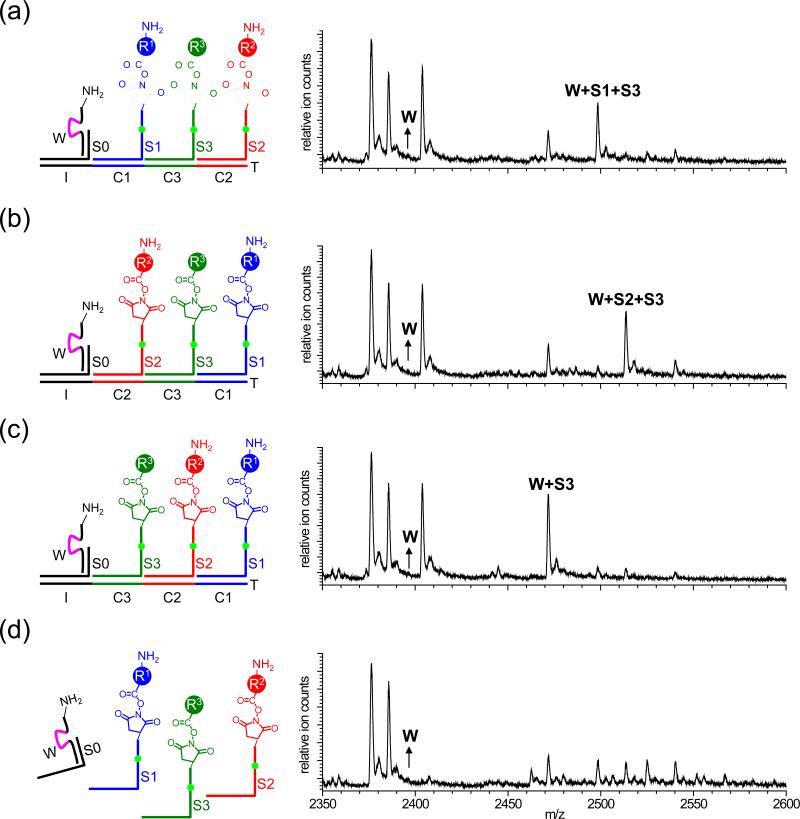
Figure 3.
Mass spectroscopy analysis of reactions identical to the one shown in Figure 2a, but using different DNA tracks (a-c) or with no DNA track (d). The DNA tracks are as follows: (a) I-C1-C3-C2; (b) I-C2-C3-C1; (c) I-C3-C2-C1; (d) no DNA track. See the Supplementary Information for all expected and observed masses.

