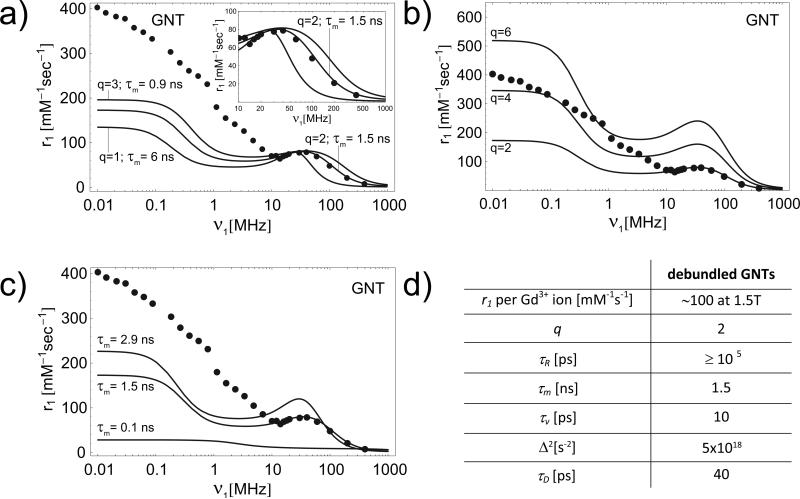
Figure 6. NMRD profiles for the GNT and the SiMP/GNT construct.
Graph showing the comparison of experimental (dotted line)9 NMRD profile and best fitting curves (solid lines) derived from the SBM theory for different values of q and τm a); for q = 2, 4 and 6 and τm = 1.5 ns; and for τm = 0.1, 1.5 and 2.9 ns and q =2 c). All other parameters as derived from the best fitting of the experimental NMRD as shown in d).

