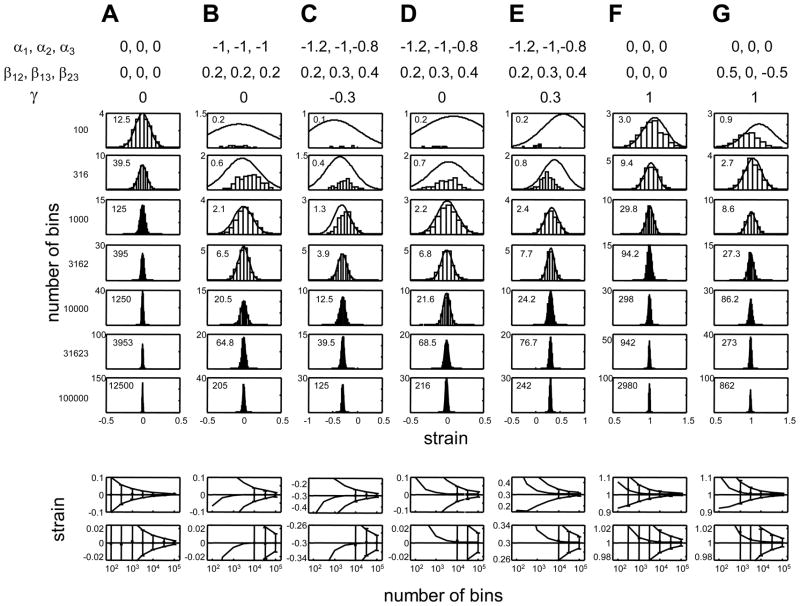
Figure A1.
The asymptotic distribution of bias and variance estimates of the plug-in estimator for the strain are highly accurate, provided that there are at least 10 counts of each firing pattern. In the upper half of the Figure, the asymptotic Gaussian distribution (smooth curve) is compared to the empirical distribution of the plug-in estimator, eq. (A11). The Gaussian has a mean given by the asymptotically debiaser (A21) and variance corresponding to the asymptotic estimate (A24). The histograms show the empirical distribution of the plug-in estimator (A11) for 1000 simulated experiments. In each set of simulations, spike pattern counts are distributed in a Poisson fashion according to the probabilities given by eq. (7), with the parameters for the right-hand-side indicated at the top of each column. From top to bottom, the number of bins in the experiment increases from 102 to 105; the latter value is comparable to the number of bins used in the experiments reported here. Note that when the number of bins is small (upper rows), some of the spike patterns are not encountered, so the plug-in estimator diverges; these counts are not included in the histograms. The numbers inset into each plot indicate the expected number of counts of the least likely firing pattern. Note that when there are at least 10 counts of each firing pattern, the asymptotic Gaussian provides an excellent approximation to the empirical distribution.
The lower half of the Figure shows the mean (points) and standard deviation (error bars) of the empirical distribution of the plug-in estimator, as a function of the number of bins in the simulated experiment. Points are only plotted when all of the 1000 simulated experiments had at least one count of all patterns. The horizontal line indicates the true value of the strain. The three smooth curves indicate the asymptotic estimates of the mean and standard deviation, according to eqs. (A21) and (A24). The two rows show the same data plotted on different vertical scales, so that the biases can be clearly seen.

