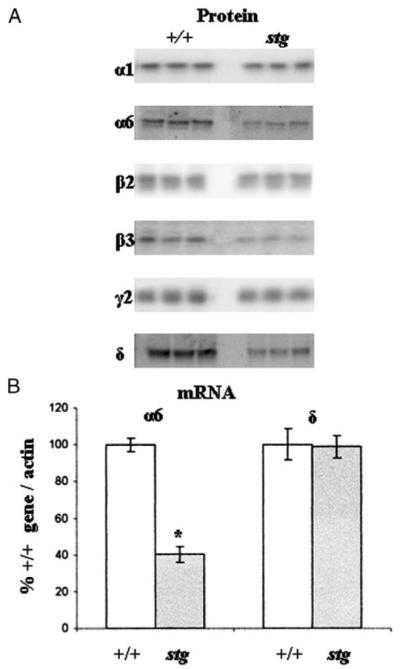
FIGURE 7.

A, Western blot analysis indicating changes in the abundance of GABAR subunits expressed in control (+/+) and stargazer (stg) cerebella. Immunoblots show the analysis of the six predominant GABAR subunits known to be present in cerebellar membranes of three +/+ and three stg mice. There was a large decrease in the intensity of the immunoreactive bands for the α6 (49 ± 2%) and δ (52 ± 3%) subunits and a weaker decrease in α1 (85 ± 1%), β2 (85 ± 2%), and β3 (64 ± 5%) subunits in stg cerebella p < 0.01. No significant changes in the intensity of the bands for γ2 (95 ± 4%) subunit were observed in stg cerebella p > 0.05. B, semi-quantitative RT-PCR amplification of cerebellar α6 and δ GABAR subunits mRNAs transcribed by control (+/+) and stargazer (stg) mice. Primer pairs specific for GABAR subunits α6 and δ cDNAs were designed as described previously (11, 29). In each case 1.0, 0.6, 0.4, 0.2, 0.1, and 0.05 μg of total RNA isolated from +/+ and stg cerebellum was reverse transcribed (RT) in a total volume of 35 μl of RT mix. 2 μl of each cDNA sample was removed for PCR amplification. Optimized amplification strategies were designed for each subunit cDNA. Following separation on a 1.2% (w/v) agarose gel and ethidium bromide staining, PCR products were visualized under UV light, and band image intensity was measured. The levels of the GABAR subunit mRNAs transcribed were normalized for β-actin mRNA transcription. Relative GABAR subunit mRNA levels found in +/+ and stg cerebellum are shown. Messenger RNA was isolated from a minimum of two +/+ and two stg mice. RT-PCR experiments were performed a minimum of three times each. Asterisk indicates significant difference (p < 0.05).
