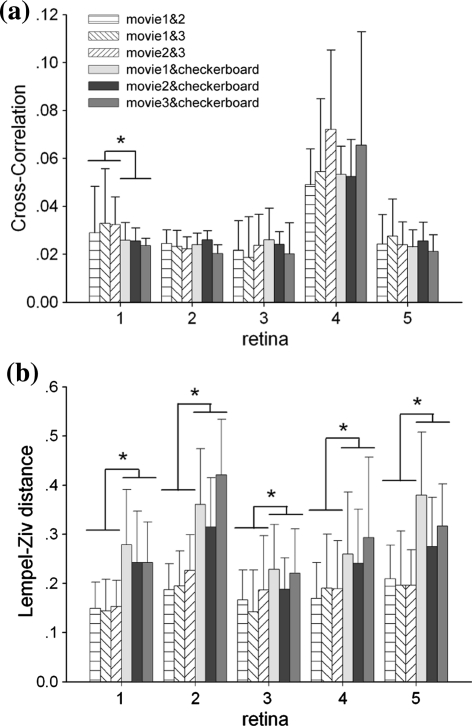
Fig. 3.
The spike timing correlations and pattern correlations were calculated by cross-correlation function (a) and LZ distance (b) between each single neuron’s responses to different stimulus. The result was averaged in each retina. The paired t-test is implemented between the movie-movie correlation values and movie-checkerboard correlation values of each neuron’s response. For the cross-correlation result, p = 0.0028, 0.5746, 0.8148, 0.3466, 0.0512, respectively, in 5 retina. Only the neural responses in the first retina are correlated to similar stimuli. For the LZ distance result, p = 6.5353e-013, 0, 0.0015, 2.2926e-008, 0, respectively, in 5 retinas. Consequently, cross-correlation values under two kind stimuli groups do not make any obvious difference here and Lempel–Ziv distances are significantly smaller in movie-movie pairs than those in movie-checkerboard pairs. But no obvious difference is shown within movie-movie or movie-checkerboard groups in both cross-correlation and LZ distance results (balanced one-way ANOVA, cross-correlation: p = 0.0545, 0.9347, LZ distance: p = 0.3005, 4.6910e-005 for movie-movie and movie-checkerboard respectively)

