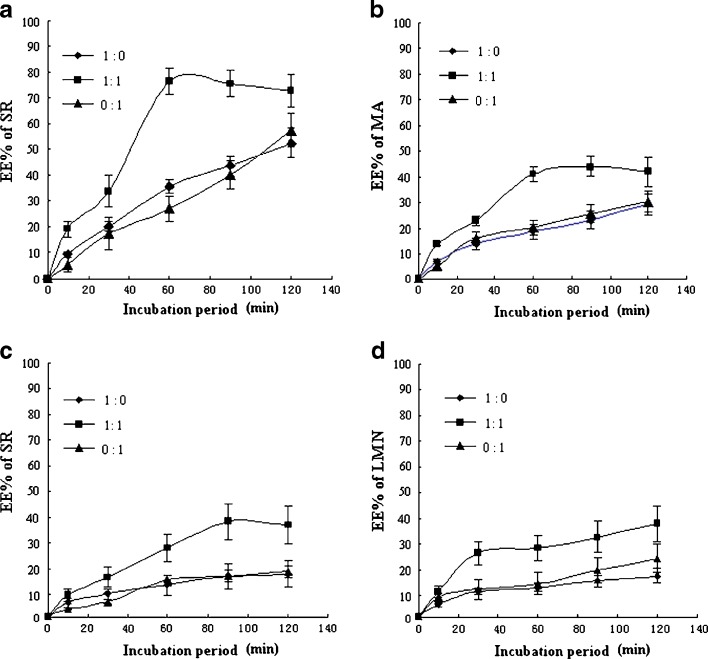
Fig. 9.
Influence of the volume ratio of ethanol to propylene glycol (1:0, 1:1, 0:1 v/v) on the EE of SR, MA, SC and LMN in TASA at different time points. a Influence of the volume ratio of ethanol to propylene glycol on the EE of SR in TASA at different time points. b Influence of the volume ratio of ethanol to propylene glycol on the EE of MA in TASA at different time points. c Influence of the volume ratio of ethanol to propylene glycol on the EE of SC in TASA at different time points. d Influence of the volume ratio of ethanol to propylene glycol on the EE of LMN in TASA at different time points

