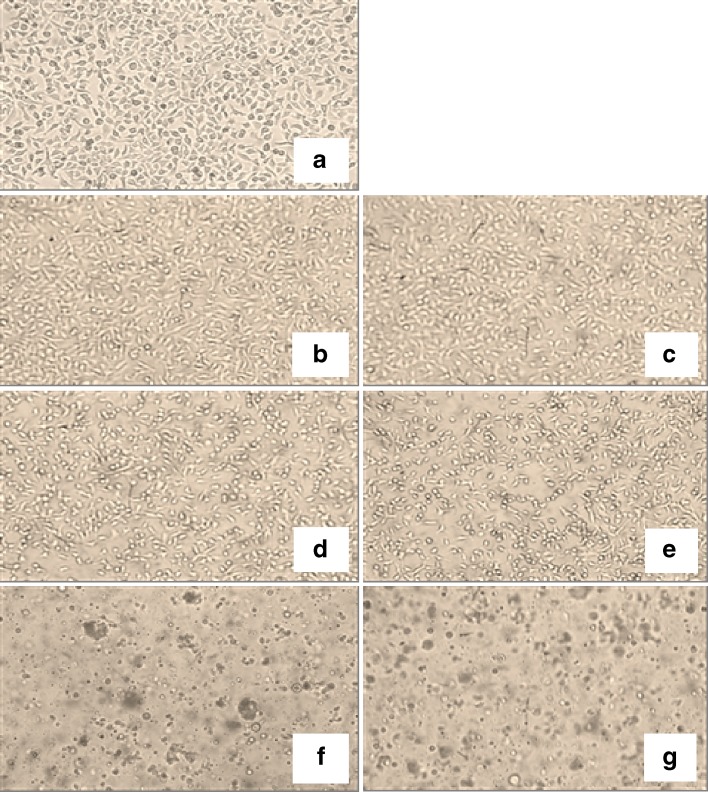
Fig. 7.
Representative live-cell light transmission micrographs of NCTC 2544 morphology (phase annulus of ×10); a PBS (control); b, c TDBO-loaded and unloaded o/w ME at 0.9 mg/ml; d, e TDBO-loaded and unloaded o/w ME at 2.25 mg/ml; f, g TDBO-loaded and unloaded o/w ME at 4.5 mg/ml. Micrographs were taken after 4-h incubation with test samples

