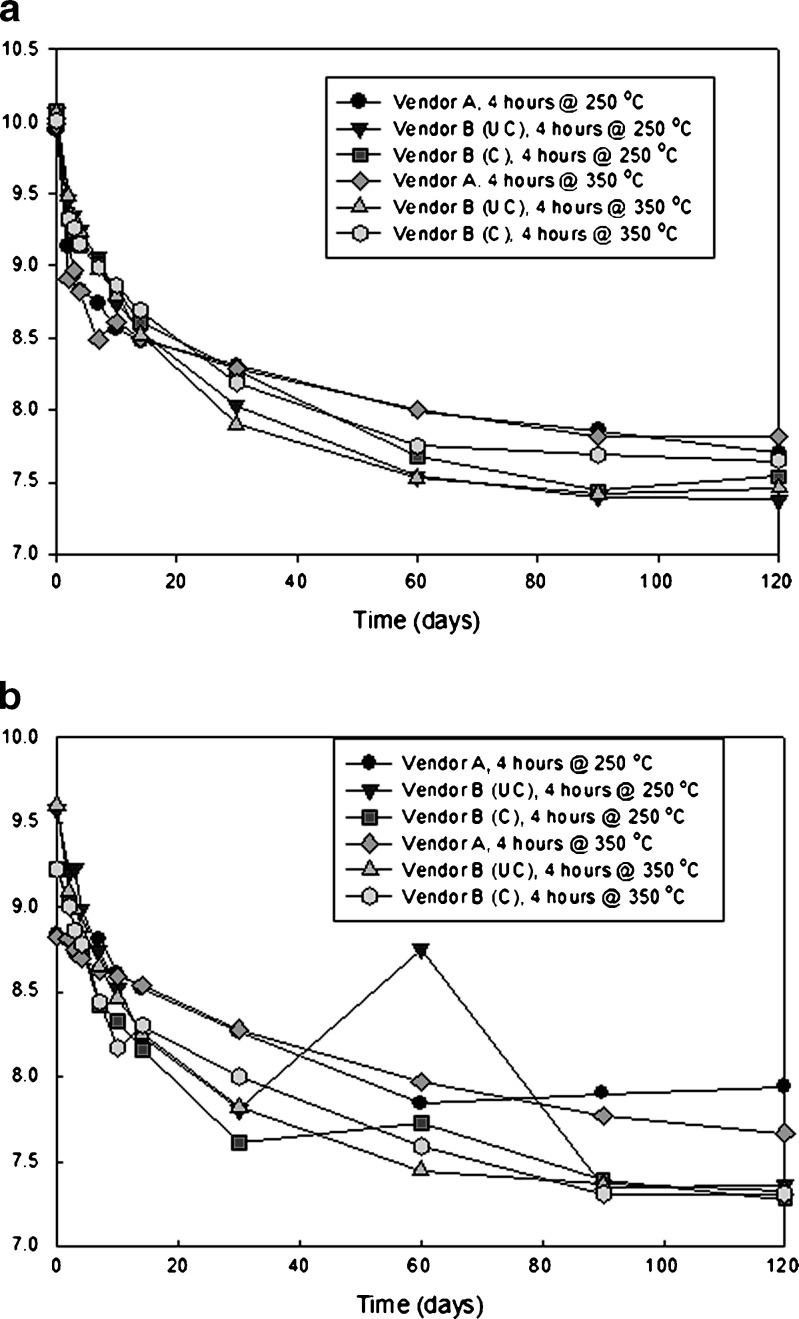
Fig. 3.
Plot showing pH as a function of time for glutaric acid solutions in different presentations stored at 60°C: a vials with no terminal sterilization, b vials receiving two (2) terminal sterilization cycles. (UC uncoated, C coated. Additionally, the data point at 60 days for uncoated vendor B vials is an anomaly that has no assignable cause)

