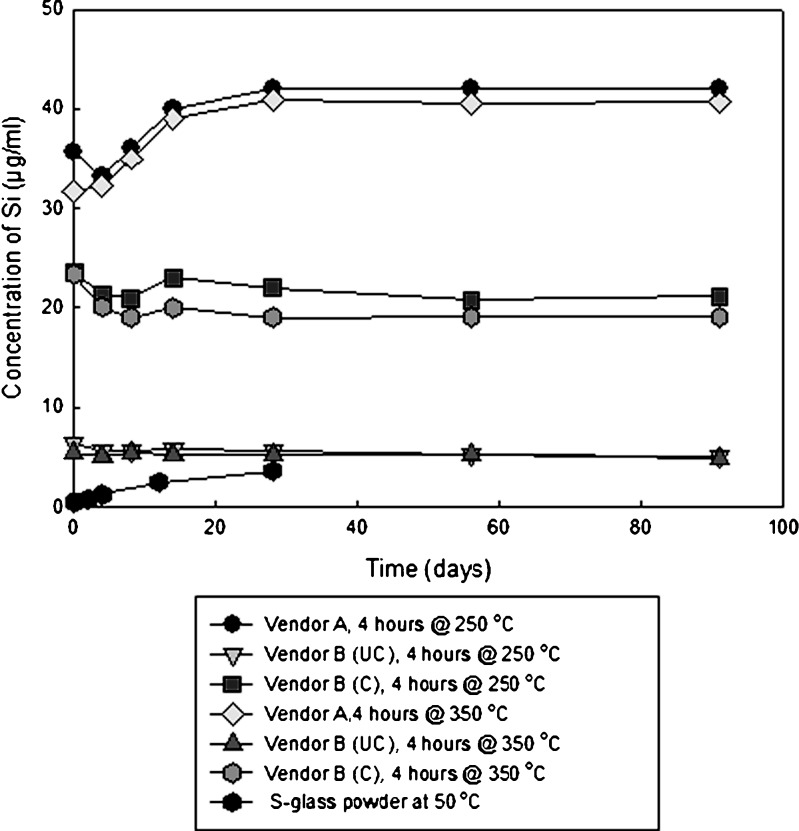
Fig. 6.
Plot of silicon concentration as a function of time for vials containing glutaric acid, with two terminal sterilization cycles, stored at 40°C. The S-glass data were obtained from powder being immersed in deionized (pH = 7) water at 50°C, and is being shown as a comparator (32)

