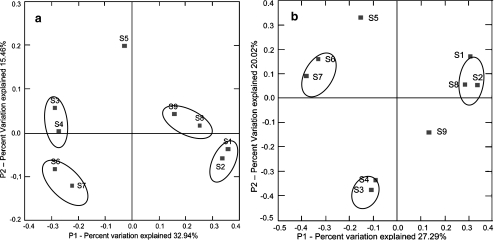
Figure 5.
PCoA ordination diagrams of the anammox bacterial assemblages calculated with 16S rRNA gene sequences (a) and HZO protein sequences (b) from production water of Shengli Oilfield. Shown are the plots of the first two principal coordinate axes (P1 and P2) for PCoA and the distributions of the anammox bacterial assemblages (designated with the sampling wells) in response to these axes

