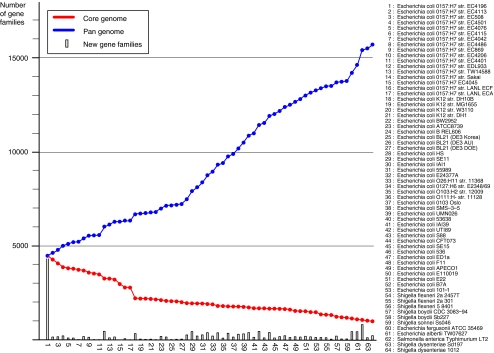
Figure 4.
Pan- and core genome plot of the analyzed genomes. The blue pan-genome curve connects the cumulative number of gene families present in the analyzed genomes. The red core genome curve connects the conserved number of gene families. The gray bars show the numbers of novel gene families identified in each genome

