
Figure 5.
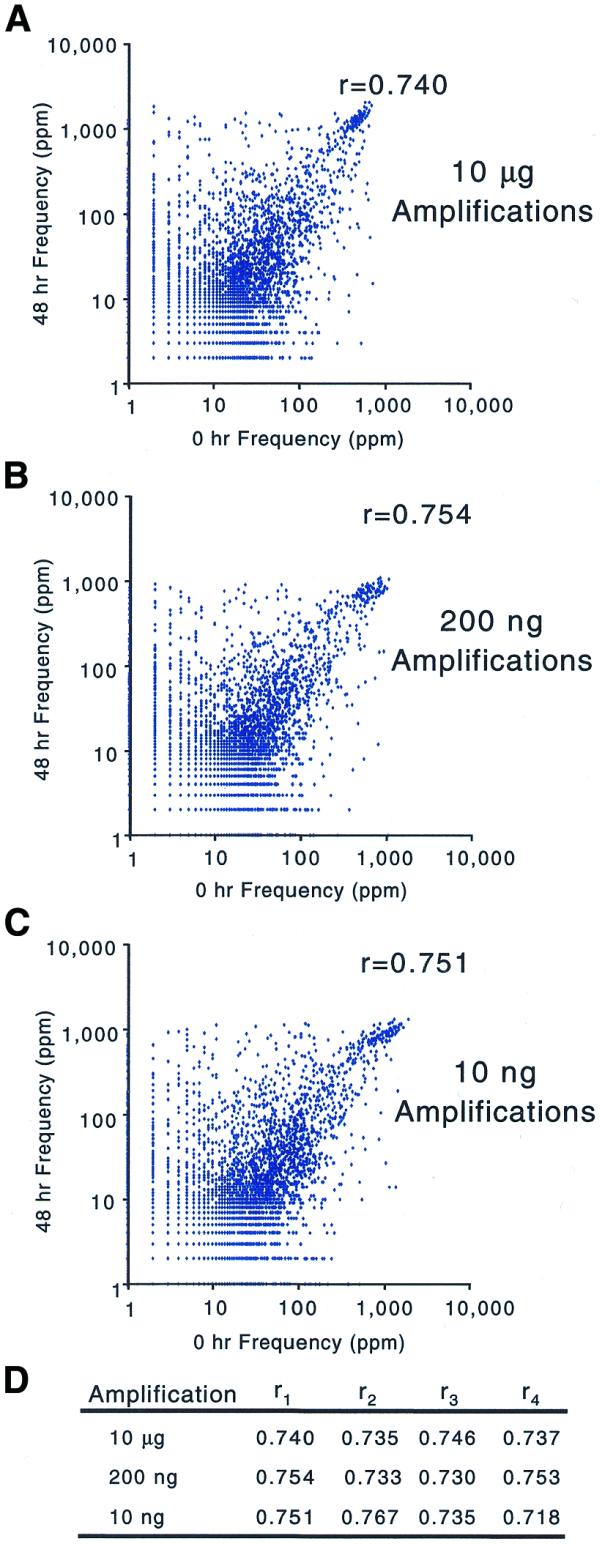
Scatter plots of gene frequencies for diverse RNA samples. The scatter plots compare the gene frequencies of embryonic versus adult RNA after amplification from different starting amounts of total RNA: (A) 10 µg, (B) 200 ng and (C) 10 ng total RNA. (D) The complete set of correlation coefficients.