
FIG. 1.
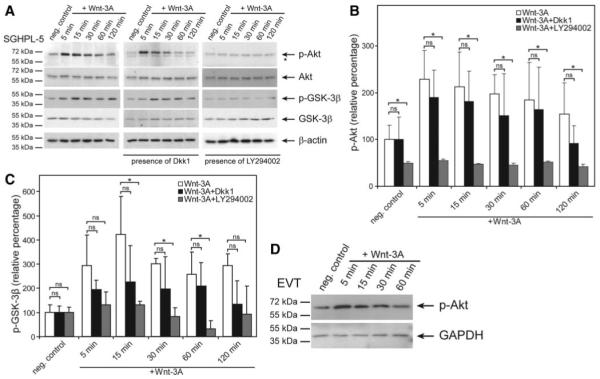
Western blot analyses showing Wnt-3A-induced AKT and GSK-3β phosphorylation. Stimulation of primary EVT and trophoblastic SGHPL-5 cells (in the absence or presence of inhibitors), preparation of protein lysates and Western blot analyses were performed as described in Materials and Methods. Marker bands (kDa) are depicted on the left. β-Actin (42 kDa) was used as a loading control. Representative examples of n = 3 are shown. A, Phosphorylation (p-) of AKT and GSK-3β in the absence or presence of Dkk1 or LY294002. Specific signals of p-Ser473-AKT (60 kDa), total AKT (60 kDa), p-Ser9-GSK-3β (46 kDa), and total GSK-3β (46 kDA) are depicted by arrows. *, Nonspecific signal. B and C, Quantification of p-Ser437-AKT and p-Ser9-GSK-3β signals, respectively, after densitometric scanning of films (n = 3). Mean values of unstimulated controls (n.c.) were arbitrarily set at 100%; error bars indicate sd. ns, Not significant; *, P < 0.05. D, Wnt-3A-dependent activation of AKT in primary EVT. A representative example is shown. GAPDH, Glyceraldehyde 3-phosphate dehydrogenase.