Fig. 4.
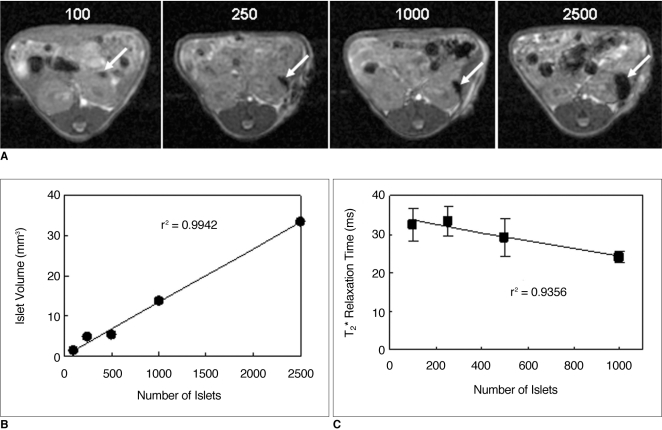
MRI quantification of transplanted islets in normal mice. Different numbers (100, 250, 1000, and 2500) of porcine islets were transplanted into kidney capsules.
A. Gradient echo T2*-weighted axial images show areas of hypointensity (arrows) in kidney capsules corresponding to different numbers of transplanted islets.
B. Graph shows linear correlation (r2 = 0.9942) between transplanted islet number and graft volume as quantified on gradient echo T2*-weighted images.
C. Graph shows linear correlation (r2 = 0.9356) between islet number and T2* relaxation time as measured on gradient echo T2*-weighted images.

