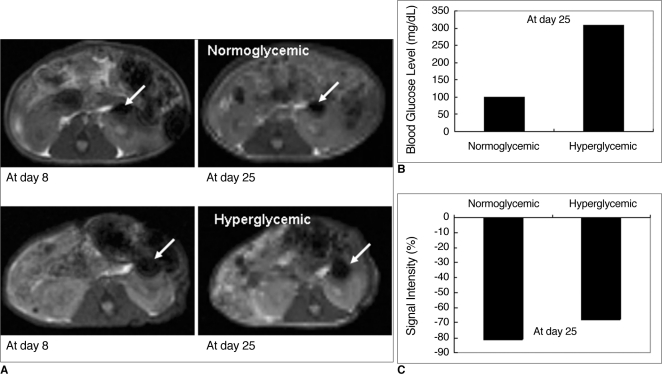
Fig. 6.
Correlation between MR signal intensity changes and blood glucose levels in diabetic mice with labeled islets.
A. Gradient echo T2*-weighted axial images show low signal intensity areas (arrows) in capsules of left kidneys of normoglycemic and hyperglycemic mouse at 8 and 25 days of post-transplantation.
B. Blood glucose levels measured 25 days after transplantation of labeled islets in normoglycemic mice (n = 2) and hyperglycemic mouse (n = 1) were 120 ± 4.3 mg/dL and 308 mg/dL, respectively.
C. Decreases in MRI signal intensities measured 25 days after transplantation of labeled islets in normoglycemic mice (n = 2) and hyperglycemic mouse (n = 1) were 81 ± 1.0% and 68%, respectively.

