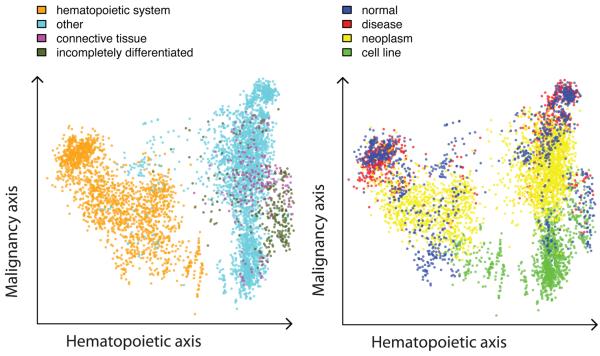
Figure 1.
Principal component analysis. Each dot represents one of the 5,372 samples in a multidimensional gene expression space projected on the principal plane formed by the first (hematopoietic) and second (malignancy) principal axes. The dots are colored semitransparently according to the biological group the sample belongs to. (a) The first principal component separates hematopoietic system–derived samples from the rest of the samples, with connective tissues and incompletely differentiated cell–based samples forming a relatively compact group on the right. The cyan dots among the blood samples on the right side represent samples from bronchoalveolar lavage cells (a possible sample contamination with blood) and kidney. The dark green dots at the center include embryonic stem cells. (b) The second principal axis predominantly arranges cell line samples at the bottom, neoplasm samples in the middle and a mixture of nonneoplastic disease and normal samples at the top.

