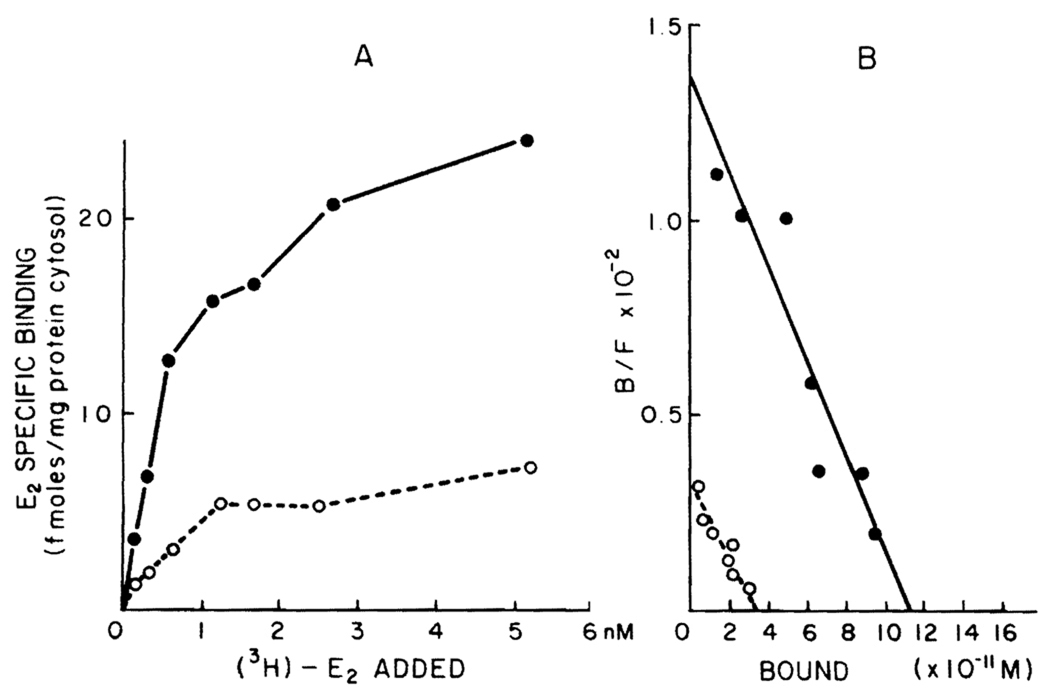
Figure 1.
A. Specific binding of [3H]E2 by cytosol of normal and regenerating male rat liver. Two-hundred microliter aliquots of cytosol (5 mg/ml) from normal or regenerating rat liver 48 h posthepatectomy precipitated with protamine sulfate were incubated with seven different concentrations of [3H]E2 (0.15–5 nM) for 18 h at 0°C in the absence (total binding) and presence (nonspecific binding) of 100-fold unlabeled E2. Specific binding was calculated by subtracting nonspecific binding from total binding. Each point is the average of triplicate determinations. B. Scatchard plot analysis of the specific [3H]E2 binding data obtained using normal and regenerating male rat liver. The specific binding data illustrated in A was replotted according to the method of Scatchard. Closed circles represent normal liver; open circles represent regenerating liver in both A and B.

