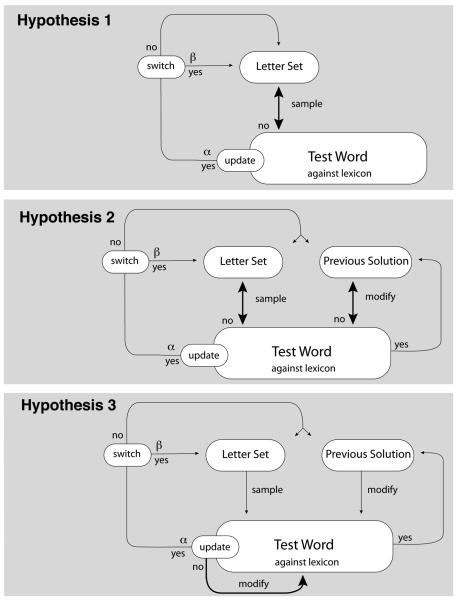
Figure 7.
The CESP models for the three hypotheses. The models are derived from the subgoal hierarchies in Figure 6. Bold lines represent switching between the terminal word production and testing subgoals. Checking for updating occurs after each word is tested against the lexicon. For example, with Hypothesis 1, participants start with the letter set, and then sample from the letter set to produce a test word, which is tested against the lexicon. The sampling and testing is repeated until either a solution is found or, with probability α, the process updates to switch between subgoals at a higher level in the tree.

