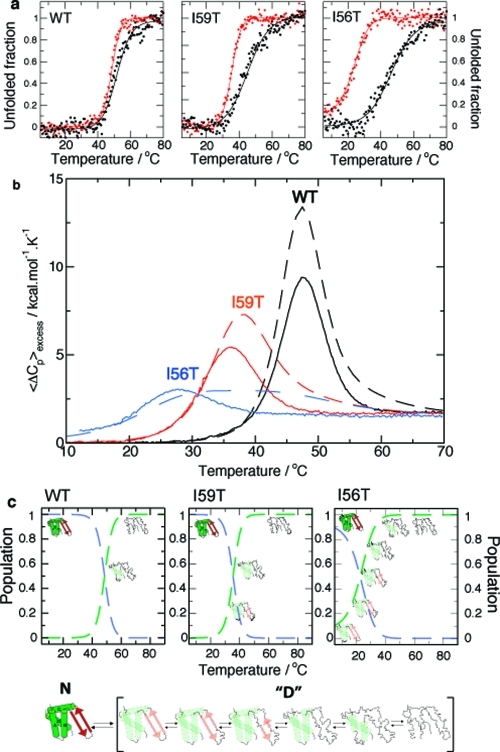
Figure 3.
Thermal unfolding of human lysozyme monitored using CD spectroscopy and DSC: a pseudo-two-state model. (a) Equilibrium thermal unfolding of WT, I59T, and I56T lysozyme, followed by near-UV (270 nm, red) and far-UV (222 nm, black) CD at pH 1.2. Thermal melts were fitted to a two-state model (fits in solid lines). For more details, see Experimental Section and the Supporting Information. (b) Evolution of excess heat capacity with temperature shown for WT (black), I59T (red), and I56T (blue) at pH 1.2. Solid lines represent the experimental data, while dashed lines show curves simulated using the thermodynamic parameters obtained from the fitting the CD data to a three-state model (see the Supporting Information). The reversibility of the thermal denaturation monitored by DSC is shown in Figure S2 of the Supporting Information. (c) Proposed model: scheme of the native state N and the denatured ensemble “D”. The populations of the native state (dashed blue lines) and denatured ensemble “D” (dashed green lines) are derived by fitting the near-UV CD first-order transition to a pseudo-two-state model.

