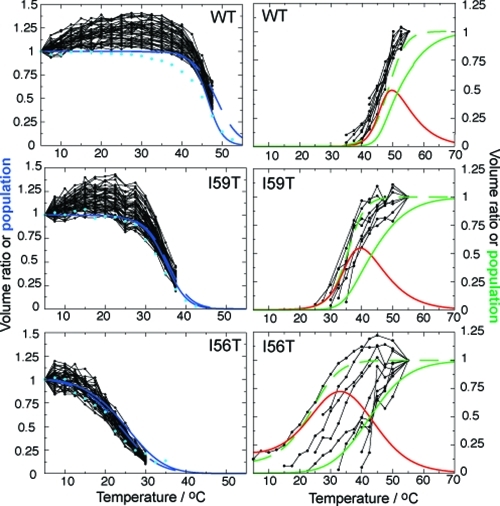
Figure 4.
NMR evidence for non-cooperative unfolding. Black dots connected by lines represent the temperature dependence of individual 1H−15N HSQC cross-peak volumes of the native state (left), normalized relative to the volume of each peak at 5 °C, and the denatured ensemble (right), normalized relative to the volume of each peak at 55 °C (see comment for WT in the Experimental Section). All non-overlapping NMR cross-peaks are shown for the decay of the native state (left), whereas the increases in cross-peak volumes of glycine residues only are shown for the denatured ensemble (right). Glycine residues have been selected because they have all been assigned in the denatured state of all three variants (see Figure 5b). Increases in cross-peak volumes for 46 assigned residues of the denatured ensemble of I56T are shown in Figure S5 in the Supporting Information and show similar results, therefore justifying the fact that only glycines are considered here. The decay of the integrated signal of selected native side chain methyl groups is shown in light blue circles in the left column (see raw data in Figure S6 in the Supporting Information). Full lines represent populations derived by simultaneously fitting far- and near-UV CD data to the three-state model: the populations of the native, intermediate, and unfolded states are indicated by the blue, red, and green lines, respectively (the population of the native state of the I56T variant is normalized to its value at 5 °C). Dashed lines show the results obtained by fitting the near-UV CD data to the pseudo-two-state model: the populations of the native state and the ‘denatured ensemble’ are shown in blue and green, respectively.

