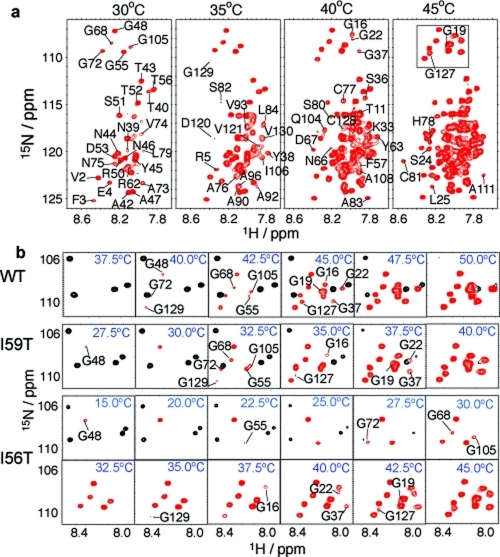
Figure 5.
Unfolding of the denatured ensemble of human lysozyme monitored by NMR spectroscopy. (a) 1H−15N HSQC spectra of the I56T mutant recorded at different temperatures show the gradual appearance of the peaks from different residues. The lowest contour level was adjusted so as not to display the weak signals of the native state at 30 °C, which has a population of ca. 20% at this temperature. The lowest contour level, the number of contours as well as the increments between them are constant across all temperatures. Changing the lowest contour level displayed does not affect the results qualitatively and only slightly affects the temperature at which a peak first appears; moreover, it affects all residues in a similar way, enabling robust comparisons to be made. (b) Region of the 1H−15N HSQC spectra (boxed in panel a) containing all resonances from glycine residues in the denatured ensemble. Resonances from the locally folded and unfolded residues are shown in black and red, respectively. The temperatures of disappearance of resonances from the native state, as well as appearance of resonances from the denatured ensemble, are summarized for all three variants in Figure S7 in the Supporting Information.

