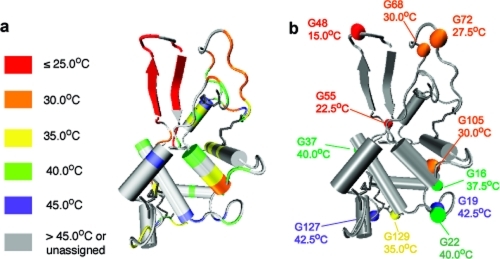
Figure 6.
Residue specific view of the locally cooperative unfolding of human lysozyme. (a) Structural location of individual residues assigned in the 1H−15N HSQC spectrum of denatured lysozyme. The color code indicates the temperature of the first appearance of the corresponding cross-peaks in the 1H−15N HSQC spectra of the denatured state of I56T, according to Figure 5. (b) As in panel a, but highlighting glycine residues.

