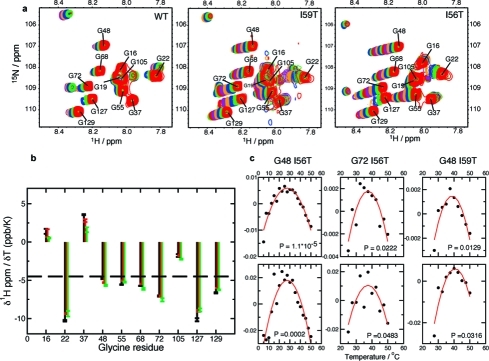
Figure 7.
Temperature evolution of 1HN and 15N chemical shifts of the denatured ensemble. (a) The glycine-rich region of the HSQC spectrum of the denatured ensembles of human lysozyme variants. In each case the top spectrum, in red, corresponds to a temperature of 50 °C; spectra were recorded every 2.5 °C and are all shown with the same contour levels as in Figure 5. (b) Temperature coefficients of 1HN amide chemical shifts of glycine residues of the denatured ensemble. The temperature coefficients are determined as the slope of a linear fit of chemical shifts versus temperature. Results are shown for the WT (black), the I59T (red), and the I56T (green) variants. (c) Plot of residuals of 1HN and 15N chemical shifts, after subtraction of the best first-order fit. The P-value shown in the inset of each graph relates to the comparison of fits to first- and second-order polynomial functions. Only residues for which one chemical shift (1HN or 15N) has P < 0.05 are shown.

