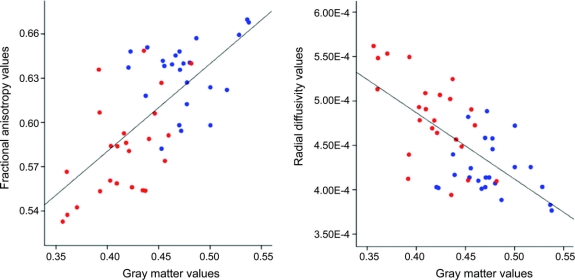
Figure 4 Scatterplot of mean fractional anisotropy (FA), radial diffusivity (RD), and gray matter (GM) values in amyotrophic lateral sclerosis (ALS) and healthy control groups
For each subject, the mean values for FA and RD (expressed in mm2.s−1), obtained in those regions found to be significantly different between the 2 groups using tract-based spatial statistics, were plotted separately against GM values obtained in those regions found to be volumetrically significantly different using voxel-based morphometry. Correlations were seen in FA vs GM (ρ = 0.64, p < 10−4) and RD vs GM (ρ = −0.61, p < 10−4) for both control (blue) and ALS (red) patient groups, with reasonable separation of the two.

