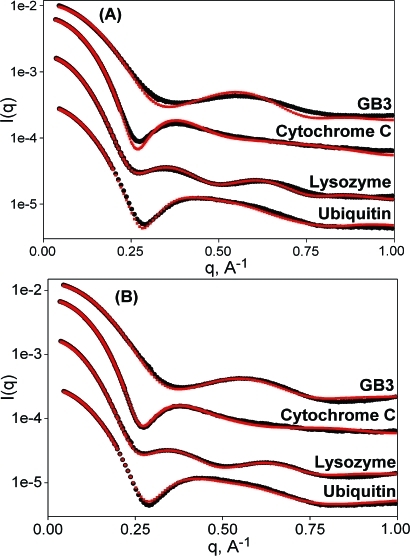
Figure 1.
Comparison of experimental (black) with predicted (red) SAXS data generated by (A) standard Crysol and (B) AXES fitting. From top to bottom, data sets correspond to GB3, cytochrome C, lysozyme, and ubiquitin (PDB entries 1IGD, 1CRC, 193L, and 1D3Z). Data sets are arbitrarily offset vertically for visual purposes.

