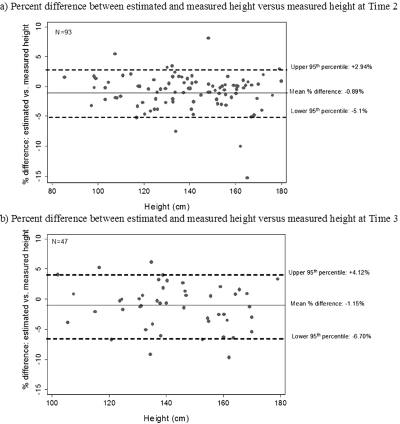
Figure 2.
Plots of percentage difference between estimated and measured height versus measured height, at time 1 (a) and time 2 (b). Center line: mean difference (negative indicates estimated height underestimates measured height). Upper and lower dotted lines: upper and lower 95% confidence interval of the percentage of difference.

