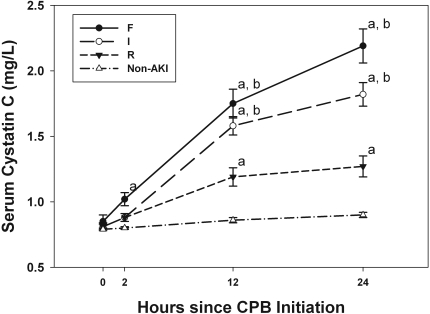
Figure 2.
Cystatin C concentrations for AKI patients stratified by pRIFLE criteria and non-AKI patients. Error bars are least square means ± SEM. “a” represents significant difference (P < 0.0001) between AKI subgroup (“R,” “I,” or “F”) and non-AKI group at the same time-point. “b” represents significant difference (P < 0.0001) between AKI subgroup “I” or “F” and the subgroup “R” at the same time-point.

