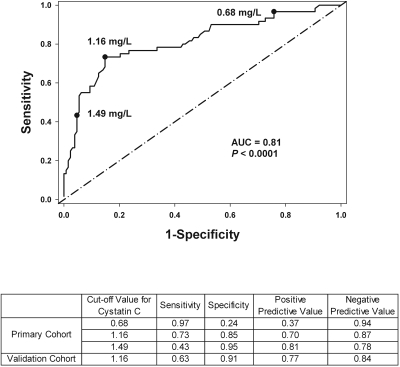
Figure 3.
ROC curve analysis using the 12-h postoperative serum cystatin C concentration in the primary cohort. The values 0.68, 1.16, and 1.49 are the 12-hour cystatin C concentrations (mg/L) corresponding to 95% sensitivity, optimal sensitivity and specificity, and 95% specificity, respectively. The table lists the sensitivity, specificity, predictive values for the primary cohort at each concentration and for the validation cohort at the optimal concentration.

